Fig. 2.
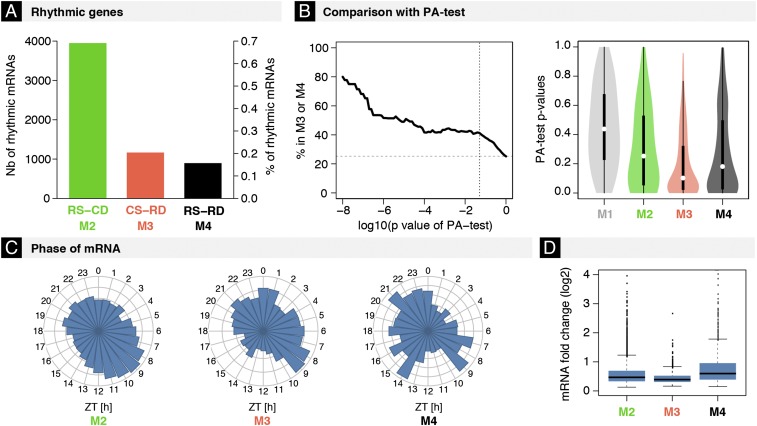
Rhythmic mRNA degradation regulates 35% of rhythmically accumulating mRNAs (∼20% in M3 and 15% in M4). (A) Numbers and percentages of rhythmic mRNAs (6,014 with FDR < 0.05, harmonic regression) identified in M2 (3,949), M3 (1,167), and M4 (898). (B, Left) Percentages of mRNAs subjected to RD estimated using the PA test, which were assigned to either M3 or M4 by our method. The analysis is stratified in function of the stringency of the PA test (log10 P values). We used published measurements of half-lives from cell lines as input for the PA test. (Right) Distribution of P values from the PA test according to the classification from our method. (C and D) Distributions of peak times (C) and amplitudes (D) of rhythmic mRNAs in M2–M4.

