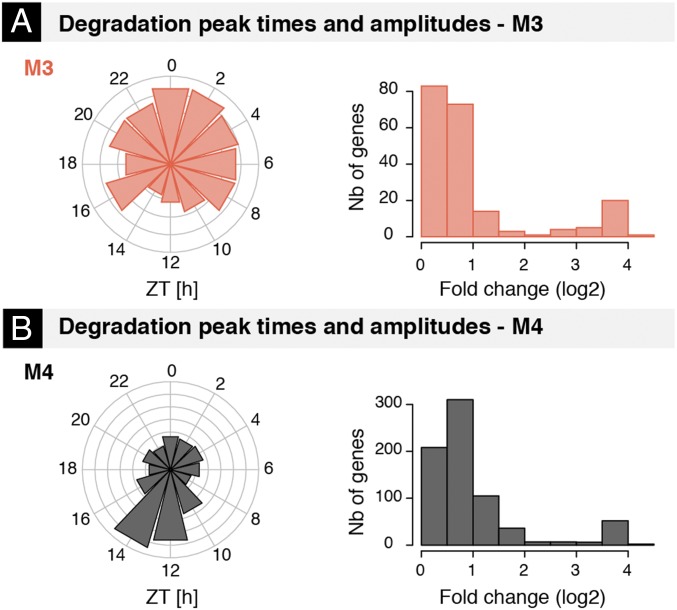
Fig. 4.
Phases and amplitudes of rhythmic mRNA degradation. (A and B) Distribution of estimated phases and peak-to-trough amplitudes (in log2) of rhythmic degradation in M3 (A) and M4 (B) for transcripts with identifiable and high-confidence degradation parameters (coefficient of variation of estimated relative amplitude <0.4 and SE of estimated phase <1 h; SI Materials and Methods and Dataset S1).

