Fig. 6.
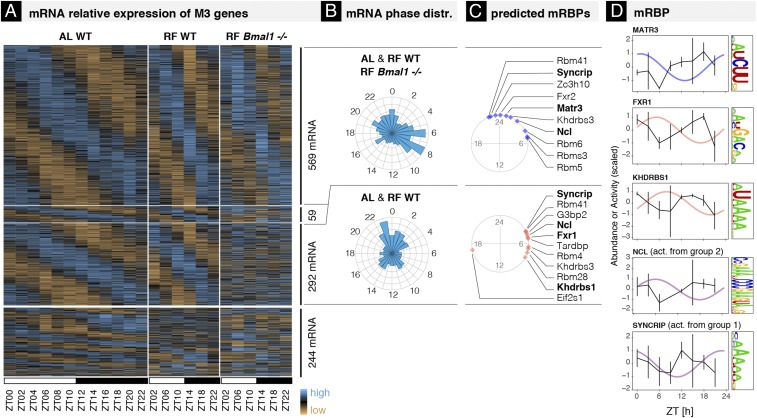
BMAL1-dependent and -independent rhythmic mRNA degradation. (A) Heat map of mRNA relative expression of genes classified in M3 in mouse liver in the following conditions (biological replicates are averaged): WT ad libitum (AL WT, Right; this condition was used for the main analysis, 12 times points, 48 samples), WT restricted feeding (RF WT, Middle; 6 time points, 12 samples), and Bmal1−/− restricted feeding (RF Bmal1−/−; 6 time points, 12 samples). All data are from ref. 8 and provided in Dataset S5, together with the parameter estimates. Genes above the thickest horizontal separator have similar rhythmic parameters in AL WT and RF WT. The two thinner horizontal separators split the genes into those that keep the same rhythmic parameters in RF Bmal1−/− (Top, 569 mRNAs, group 1), those that are expressed in a constant manner (Bottom, 292 mRNAs, group 2), and those that exhibit 24-h oscillations with altered rhythmic parameters (Middle, 59 mRNAs). (B) mRNA peak time distributions for groups 1 and 2. (C) Phases of inferred activities of mRBP motifs in groups 1 (blue) and 2 (red). Activities are inferred using a penalized linear model that integrates mRBP binding site at the 3′-UTR of mRNA with phase and amplitude of mRNA degradation (Materials and Methods). Angles on the circle indicate peak activity times (ZT times). (D) Inferred activities and protein abundance of candidate mRBPs over time (50). mRBPs are predicted to regulate stability of transcripts from group 1 (plotted in blue), from group 2 (in red), or in some cases from both groups (in purple). Rhythmic activities that are antiphasic to rhythmic protein accumulation predict a stabilizing effect.

