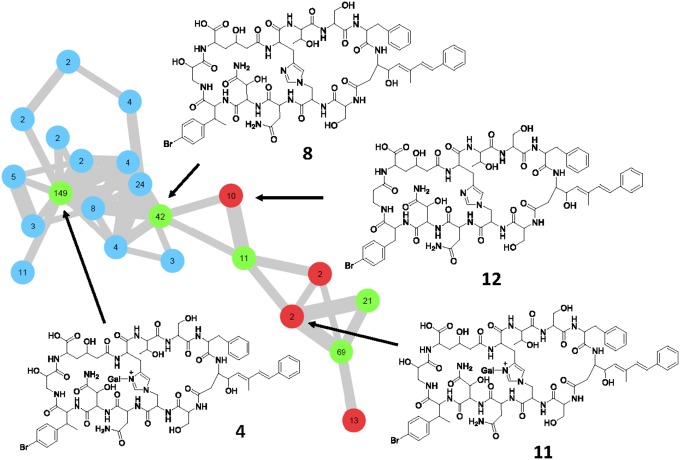
Fig. 3.
Molecular network analysis of theonellamides. Nodes are color-coded according to the sponge sample from which the data were obtained: blue, TSWA (Japan); red, TSWB (Israel); green, metabolites present in both sponges. Numbers within each node indicate the number of MS2 spectra obtained for each metabolite as a proxy for their relative abundance. The edge line width indicates the relatedness between two metabolites (cosine 0.7). This figure represents only singly charged parent ions; for a more complete version see SI Appendix, Fig. S1. The structural assignment of theonellamide B (8) is described in detail in SI Appendix, Figs. S7–S9. The full LC-MS dataset was uploaded to the MASSIVE database (MSV000081318 PW 2017) (https://massive.ucsd.edu/ProteoSAFe/static/massive.jsp) and individually annotated spectra added to the GNPS library (https://gnps.ucsd.edu/ProteoSAFe/static/gnps-splash.jsp).

