Fig. 1.
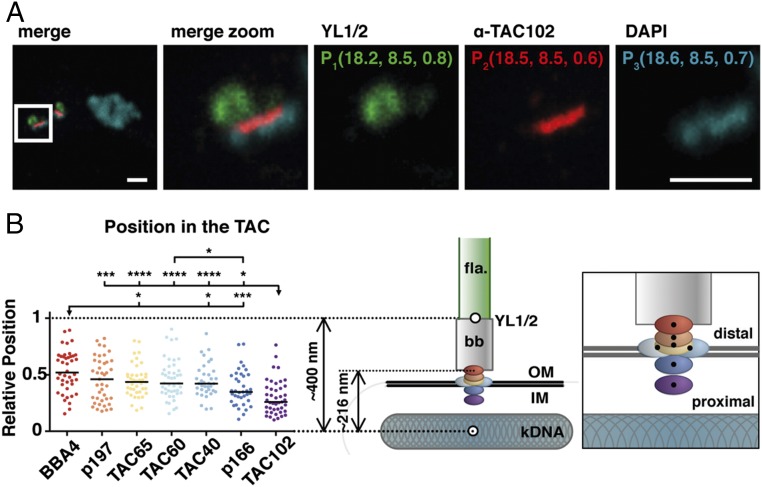
Relative position of the TAC components within the complex. (A) A representative image of a 2K1N cell stained with DAPI (DNA, cyan) and YL1/2 (basal body, green) is shown. Both channels were acquired with a confocal microscope. TAC102 is stained with a monoclonal antibody (red) and was acquired using STED microscopy. To measure the distance to the kDNA, the center of mass was calculated by using the 3D object counter from ImageJ. The xyz coordinates are shown in single color images. (B) Relative positions of the different components (BBA4, red; p197, orange; TAC65, yellow; TAC60, light blue; TAC40, blue; p166, dark blue; TAC102, purple) are indicated by dots; black line indicates the median (36 ≤ n ≤ 44). The model depicts the relative position within the TAC (right model). The flagellum (fla) is highlighted in green, the basal body (bb) in gray, the kDNA in cyan-gray, and the mitochondrial membrane by two black lines (OM, IM). A zoom-in of the TAC components within the complex is shown next to it. *P ≤ 0.05; ***P ≤ 0.001; ****P ≤ 0.0001. (Scale bar, 1 µm.)

