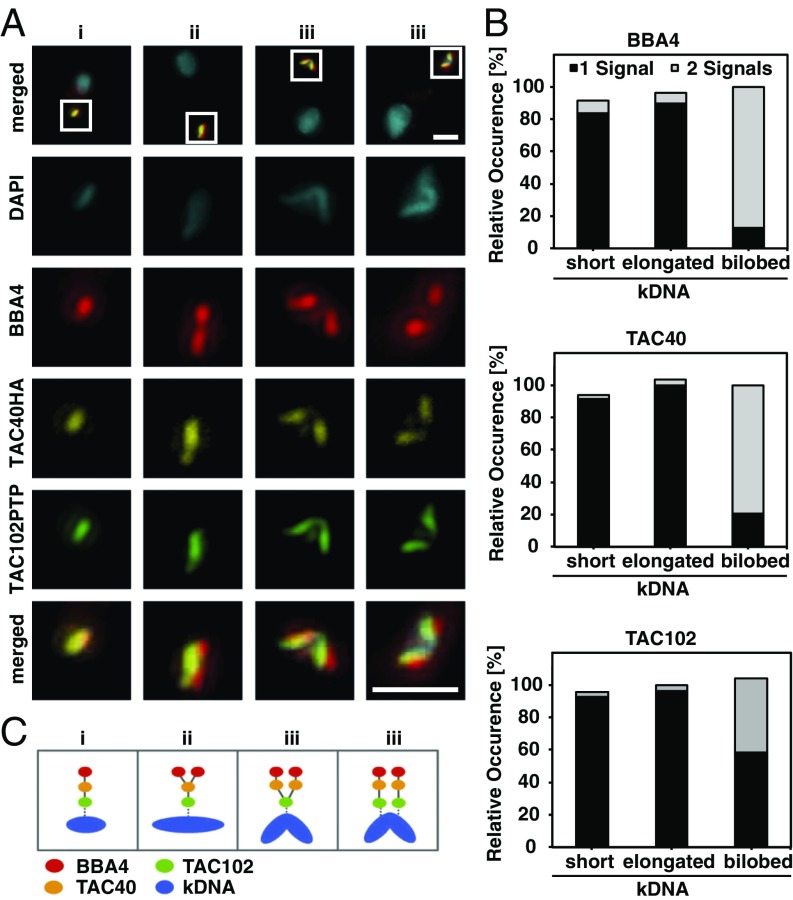
Fig. 6.
Dynamics of the TAC proteins during kDNA replication. (A) Tagged BSF cells were stained with DAPI (DNA, cyan), BBA4 (red), anti-HA for TAC40HA (yellow), and anti-ProteinA for TAC102PTP (green) to investigate the replication of the TAC in more detail. The region of the white box is shown enlarged below. (B) Cells were analyzed; cells were divided into stage i (short), ii (enlarged), and iii (bilobed) (40); and the number of signals per staining were counted (n = 125). One signal is depicted by gray and two signals by black bars. (C) A schematic model illustrates the TAC replication. (Scale bar: 1 µm.)

