Fig. 2.
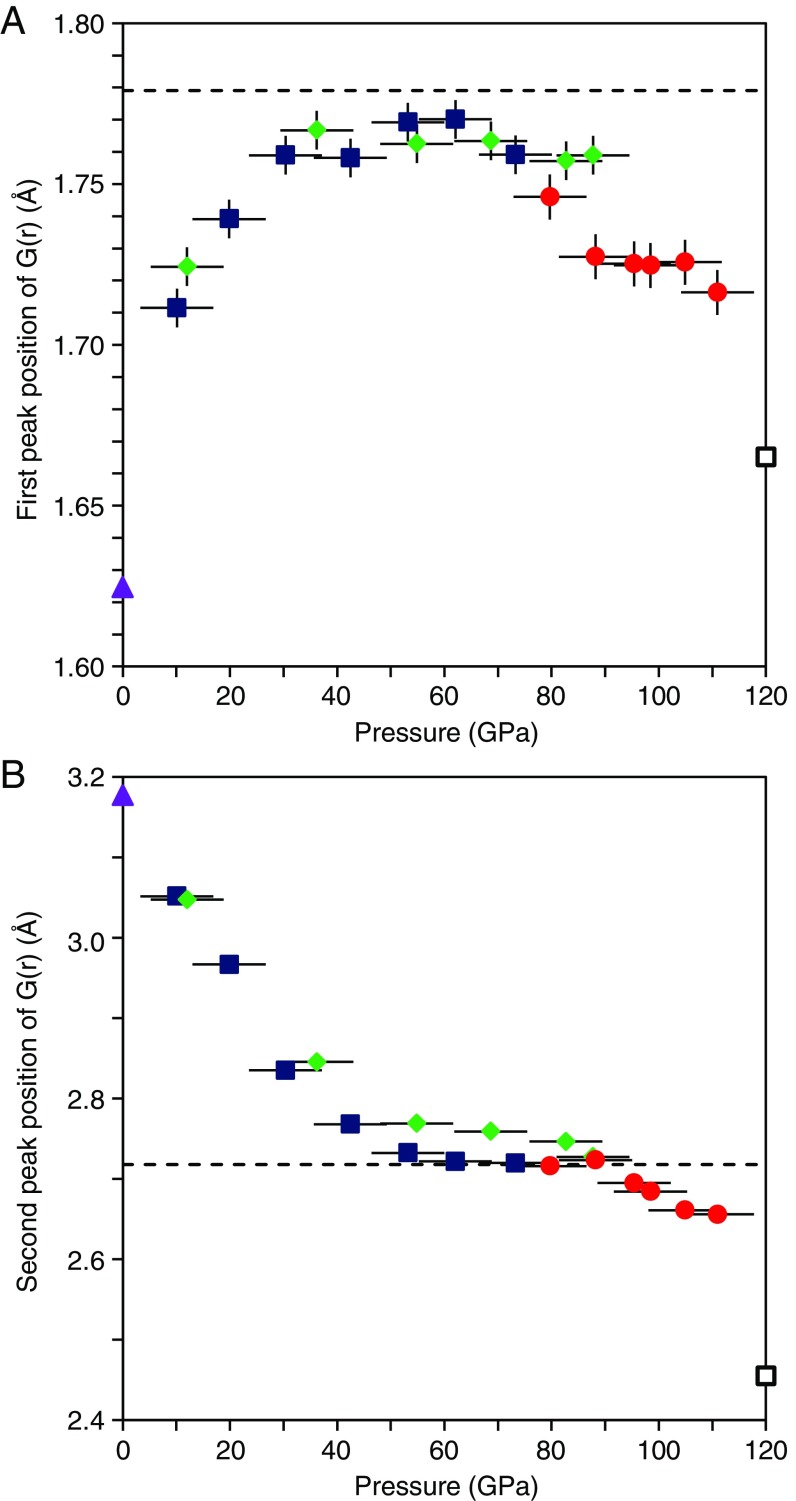
The first (r1) (A) and second (r2) (B) peak position of G(r). Blue, green, and red symbols represent the results of the experiments 1, 2, and 3, respectively. Solid purple triangles represent the r1 and r2 of MgSiO3 glass measured at ambient pressure. Dashed black line represents average Si-O (1.779 Å) (A) and Si-Si (2.718 Å) (B) distances of crystalline MgSiO3 akimotoite at 7.8 GPa (23). Open black squares represent average Si-O (1.665 Å) (A) and the shortest Si-Si (2.455 Å) (B) distances of crystalline MgSiO3 postperovskite at 120 GPa and 0 K (28). Vertical bars represent the error in r1. The error in r2 is smaller than the size of the symbols. Horizontal bars represent the cumulative uncertainty in pressure due to error in the pressure determination, pressure change during the long structure measurement, and pressure gradient in the sample.

