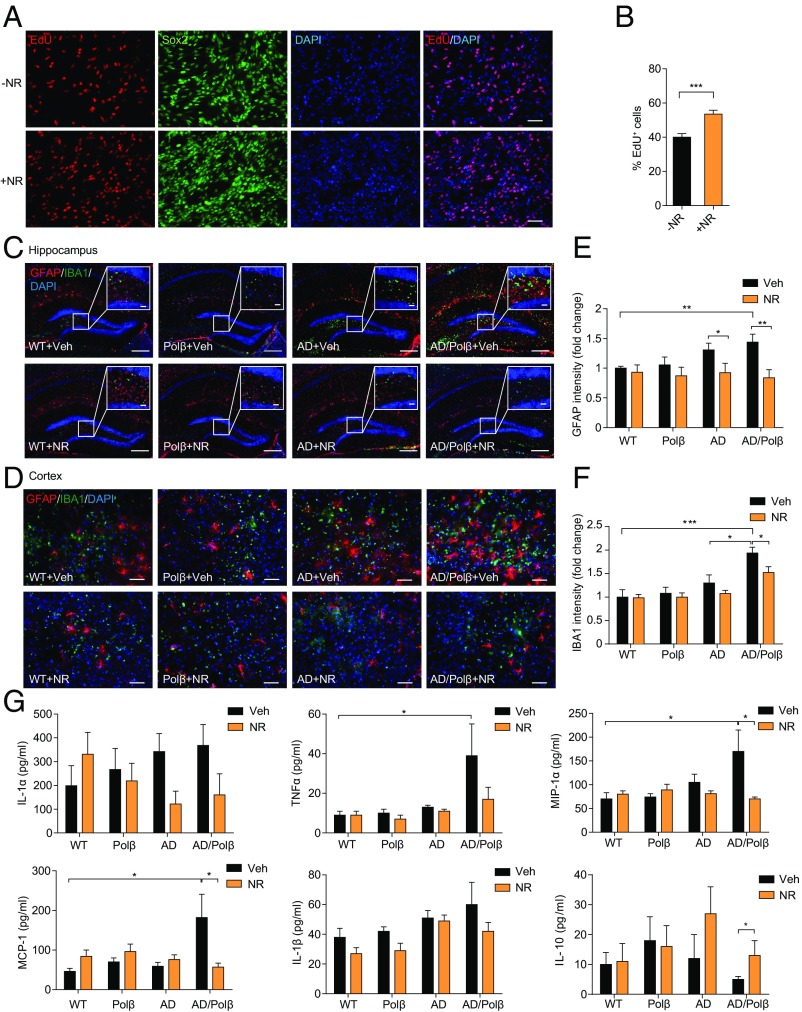
Fig. 3.
NR increases in vitro EdU incorporation in NPCs and decreases neuroinflammation. (A) Representative images of EdU (red), Sox2 (green), and DAPI (blue) staining of NPCs treated with vehicle or 1 mM NR for 24 h. (Scale bars, 50 µm.) (B) Quantification of EdU+ cells from images as in A. n = 27 control (−NR) and 26 +NR images in three experiments. (C and D) Representative images of GFAP (red) and IBA1 (green) staining of hippocampus regions (C) and cortex regions (D) from WT, Polβ, AD, and AD/Polβ mice treated with vehicle or NR. (Scale bars: 200 µm in C; 20 µm in C, Inset; 50 µm in D.) (E and F) Quantification of GFAP (E) and IBA1 (F) intensity from sections as in C and D. n = 5 mice per group. Quantifications are presented as mean ± SEM. (G) Indicated cytokine or chemokine levels in mouse plasma detected by multiplex cytokine array. n = 11 (WT + Veh), 10 (Polβ + Veh), 11 (AD + Veh), 12 (AD/Polβ + Veh), 9 (WT + NR), 10 (Polβ + NR), 8 (AD + NR), and 9 (AD/Polβ + NR) mice. Quantifications are presented as mean ± SEM. *P < 0.05, **P < 0.01, ***P < 0.001.

