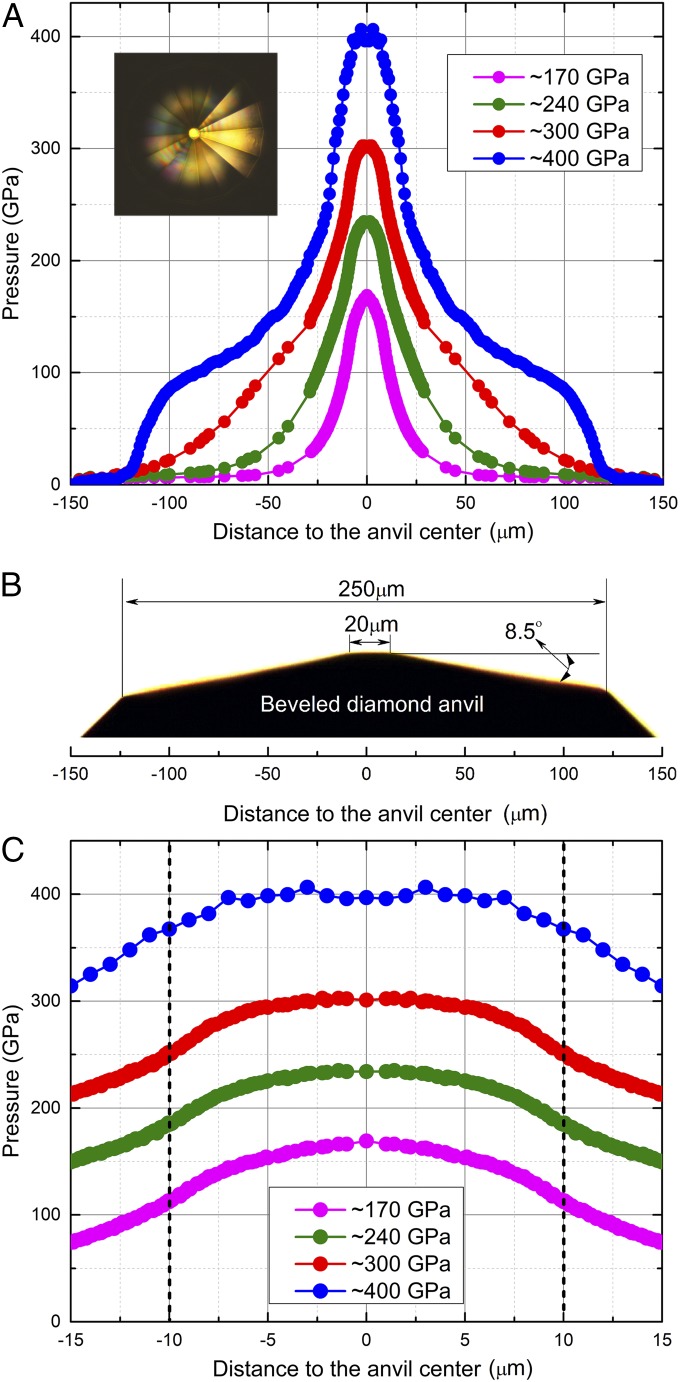
Fig. 3.
Pressure distributions in a beveled DAC. Pressure distributions as a function of the radial distance from the center of the culet at four center pressures of ∼170, ∼240, ∼300, and ∼400 GPa, respectively. (A) Large region and (C) culet region. B is a side view of the diamond anvil with a 20-μm culet beveled to 250 μm at 8.5° as a reference. The photomicrograph in A shows the reflectance in a visual observation of the tiny culet and beveled area at ∼400 GPa.

