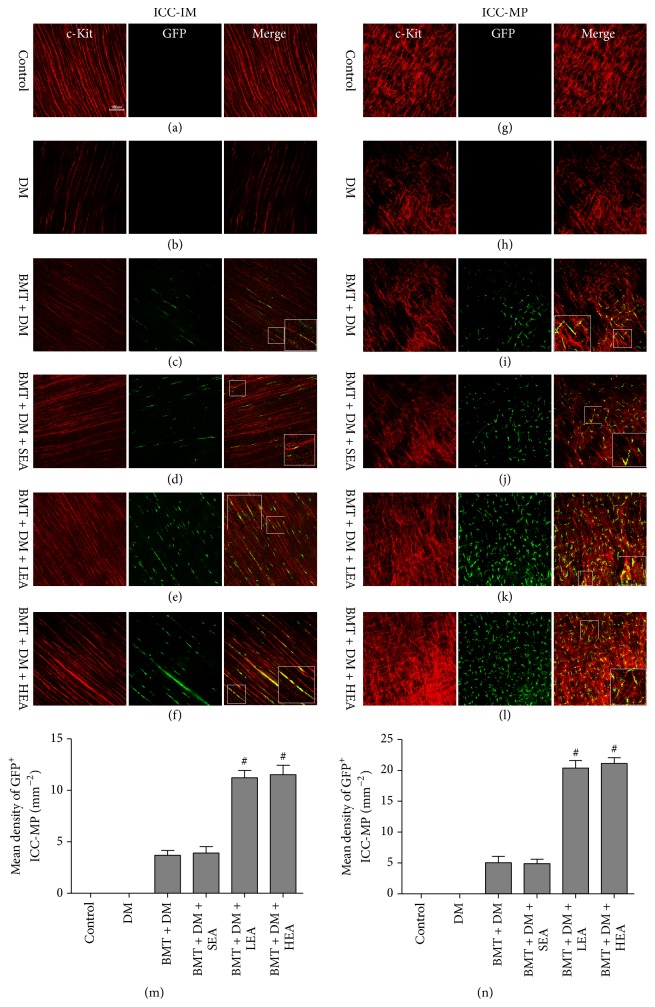
Figure 4.
Immunofluorescence images of ICC-IM (a–f) and ICC-MP (g–l) in stomach corpus tissues labeled with antibodies against c-Kit (red) and GFP (green). c-Kit+GFP+ cells among ICC-IM and ICC-MP were not observed in the control group or the DM group. The number of c-Kit+GFP+ cells among ICC-IM and ICC-MP was markedly elevated in the BMT + DM + LEA and BMT + DM + HEA groups (n = 6 for each group) compared with that in the BMT + DM group. Quantitative analysis of GFP+ICC-IM and GFP+ICC-MP was performed in different groups in (m) and (n). #P < 0.05, compared with the BMT + DM group. Scale bars = 100 μm for all panels.

