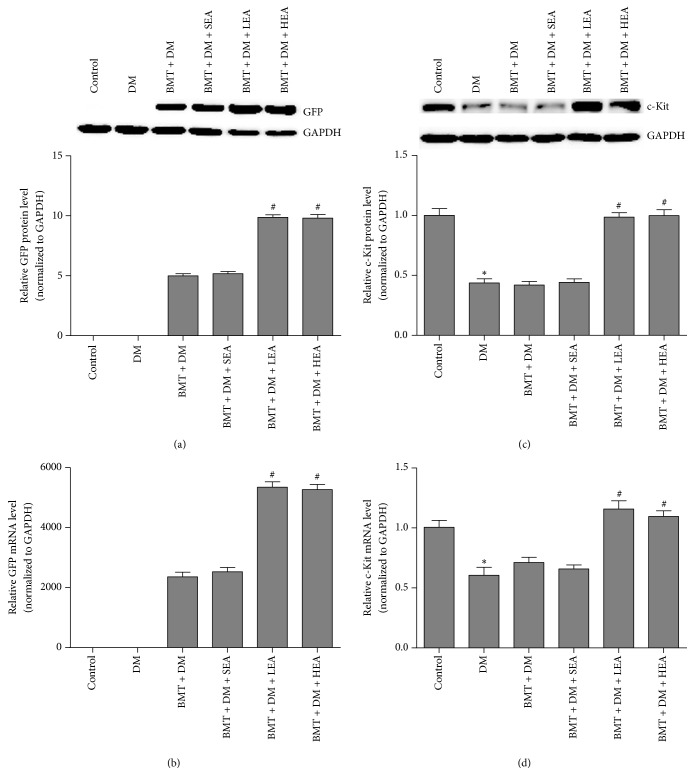
Figure 6.
Protein and mRNA expression of GFP (a, b) and c-Kit (c, d) in stomach tissue. GFP was not expressed in the control group or the DM group. Compared with the BMT + DM group, the protein and mRNA levels of GFP were significantly increased in the BMT + DM + LEA and BMT + DM + HEA groups. In addition, compared with those in the control group, the protein and mRNA levels of c-kit were significantly decreased in the DM group. Significant increases in c-Kit protein and mRNA levels were also observed in the BMT + DM + LEA and BMT + DM+ HEA groups (n = 5 for each group) compared with those in the BMT + DM group. ∗P < 0.05, compared with the control group. #P < 0.05, compared with the BMT + DM group.

