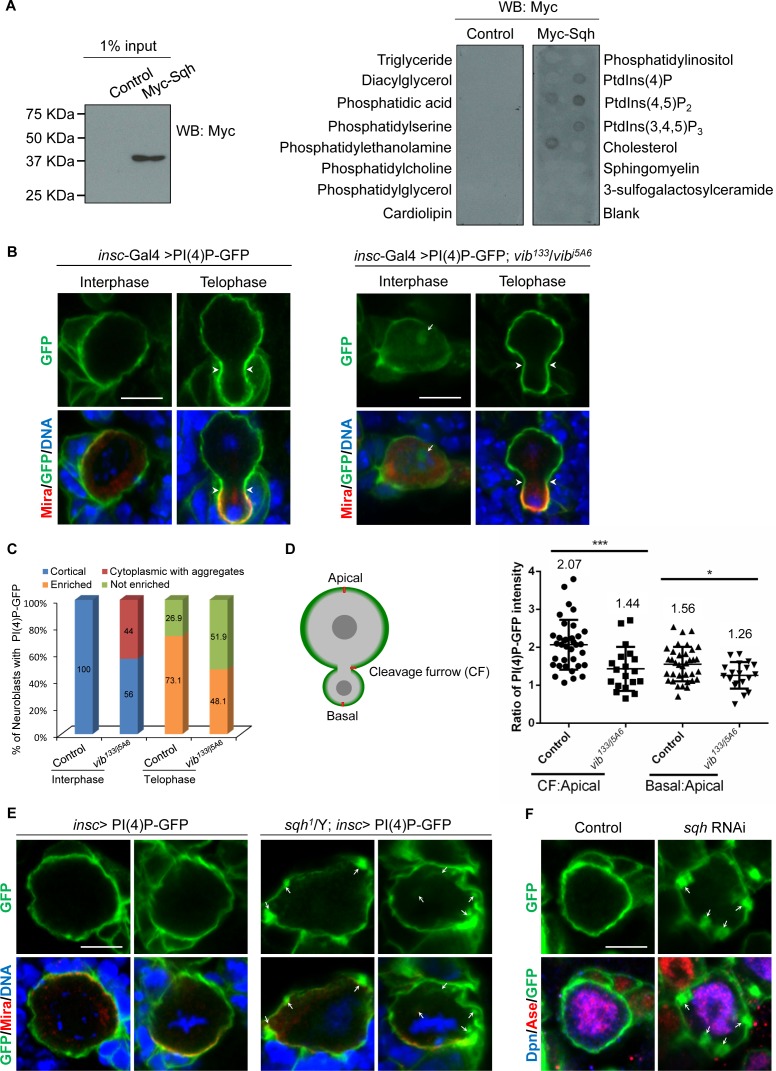
Figure 5. Sqh binds to phosphoinositide PI(4)P and localizes it to cell cortex in neuroblasts.
(A) Control (empty Myc vector) and Myc-Sqh lysates from S2 cells were used for lipid-binding assay with lipid strips. Lipid strips were blotted with Myc antibody. 1% of lysate input used for lipid-binding assay is shown in the left panel. (B) Neuroblasts of PI(4)P-GFP (2xOsh2PH::GFP, PI(4)P reporter) driven by insc-Gal4 were labeled with GFP (green), Mira (red) and DNA (blue). Neuroblasts of insc-Gal4 driven PI(4)P reporter in vib133/vibj5A6 were labeled with GFP (green), Mira (red) and DNA (blue). (C) Quantification of PI(4)P reporter localization in neuroblasts for (B). ‘Enriched’ in quantification legend refers to enriched localization at cleavage furrow, while ‘not enriched’ indicates no enrichment at cleavage furrow. (D) A schematic representation of measurement of the PI(4)P-GFP intensity for telophase neuroblasts shown in B. The red line shows the site where the measurement was taken in neuroblasts. The graph (to the right) shows the ratio of PI(4)P-GFP intensity at cleavage furrow (CF) or basal cortex to apical cortex in control and vib133/vibj5A6 expressing PI(4)P-GFP. (E) Neuroblasts of control and sqh1/Y hemizygotes expressing PI(4)P-GFP driven by insc-Gal4 were labeled with Mira (red), GFP (green) and DNA (blue). (F) Neuroblasts of control (PI(4)P-GFP driven by insc-Gal4) and sqh knockdown with PI(4)P-GFP expression driven by insc-Gal4 were labelled with Dpn (blue), Ase (red) and GFP (green). Arrowheads indicate position of cleavage furrow and arrows indicate PI(4)P-GFP aggregates. Scale bars, 5 µm.


