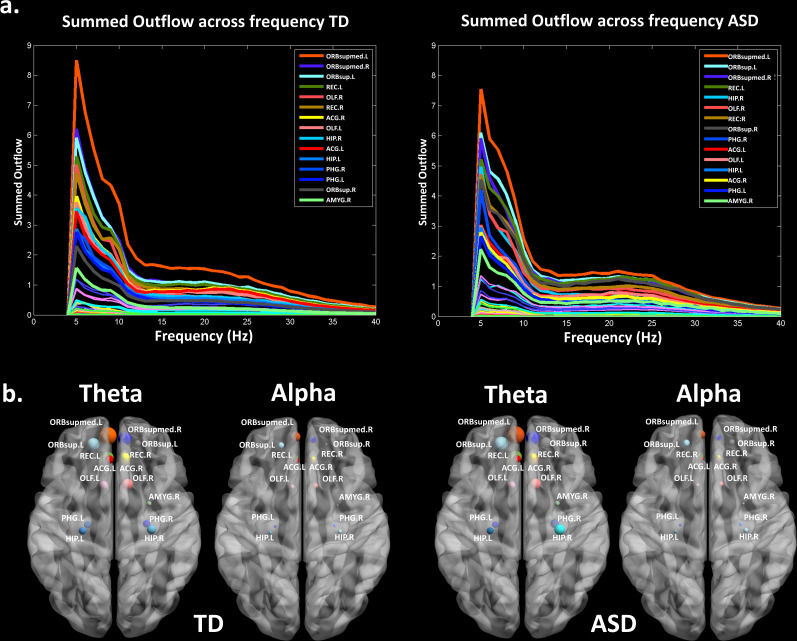
Figure 1. Summed outflow of the largest drivers across frequencies.
(a) The summed outflow of the largest drivers across frequencies is illustrated for each group (TD, Left; ASD, Right). (b) Regions consistently showing large driving in both groups for theta and alpha. Summed outflows are represented as spheres: the larger the sphere, the higher the summed outflow. ROIs are displayed on an ICBM Average Brain, axial top view. See acronyms list in Table 2.

