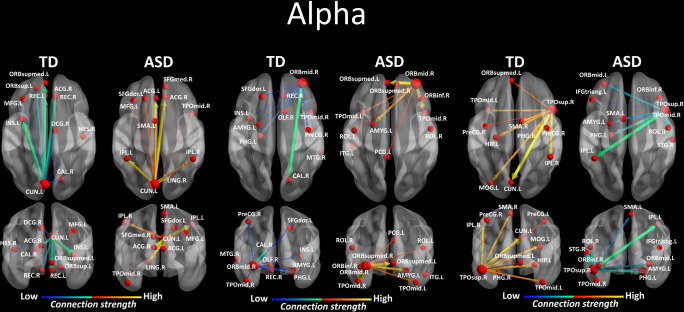
Figure 4. Region-to-region directed functional connectivity for the alpha band (8–12 Hz) from each of the three significant ROIs, represented as large red spheres.
Outflows are represented as arrows: the larger the arrow, the stronger the outflow. ROIs and connections are displayed on an ICBM Average Brain, axial and coronal views. See acronyms list in Table 2.

