
Figure 2.
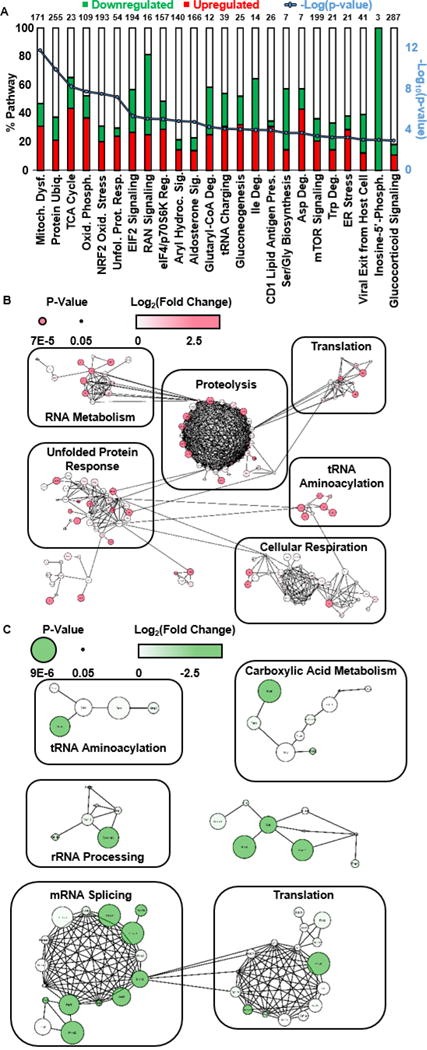
(A) Pathway enrichment results for proteins found to have significant differential regulation due to exposure to 500 μM BMAA compared to control. Upregulated (green) and downregulated (red) are plotted as a percentage of the total number of proteins within the pathway, shown on top of the bar chart. (B) Protein interaction network for proteins found to be upregulated in 500 μM BMAA exposed cells compared to control. (C) Protein interaction network for proteins found to be downregulated in 500 μM BMAA exposed cells compared to control.