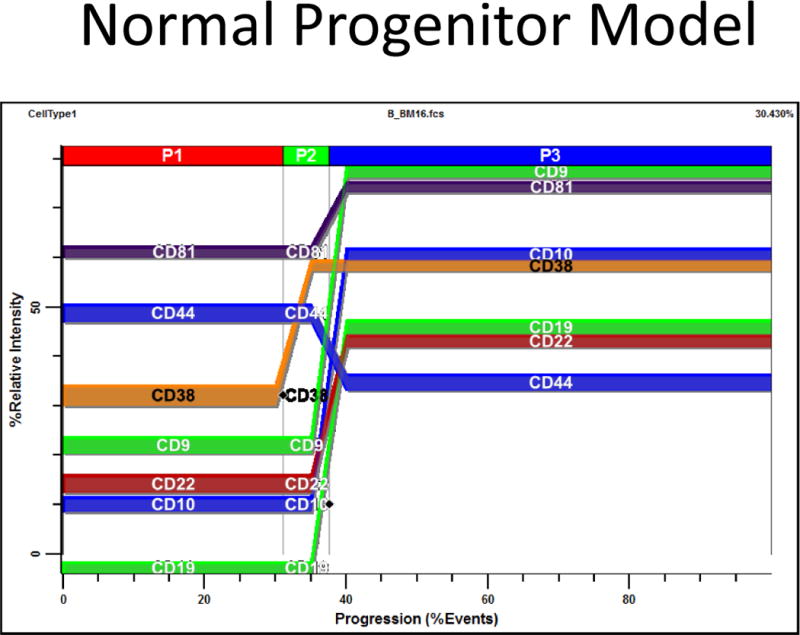
Figure 6.

Average Progenitor Model. Based on the Progenitor Staging results, a normal progenitor model was constructed that constrained appropriate marker modulations to the two critical control points shown in Figure 5 and Table 3 (see a, b). Those markers that were not widely represented in this study (CD81, CD22, CD9, and CD44) were placed on the nearest stage boundary. Most analyses were performed unattended and the average model is presented as a PSM overlay plot in Figure 6. At the end of P1, CD38 up-regulates. At the end of P2; CD19, CD10, CD81, CD22, and CD9 up-regulate while CD44 down-regulates slightly.
