
Figure 10. Representative COLM images of 2 mm-thick lectin-stained vasculature in the motor cortex region.
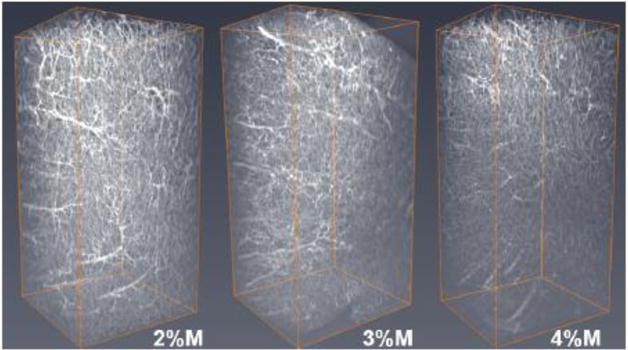
Comparison of lectin signal in tissue perfused with acrylamide monomer concentrations of 2%, 3% and 4% (left to right). Abbreviations: M; monomer.