
Figure 3. Representative confocal images of PV immunofluorescence in the anterior cingulate cortex region.
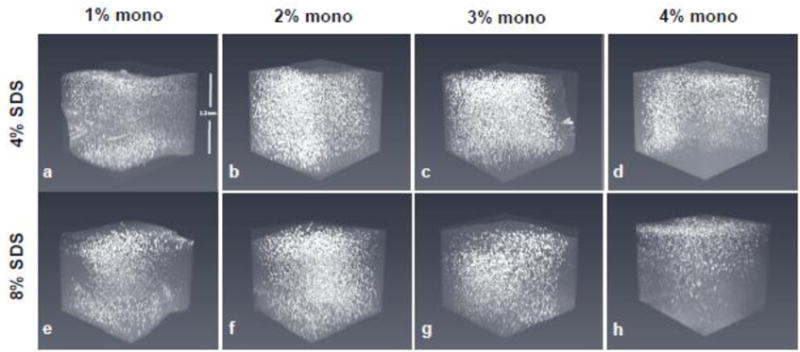
Comparison of positive signal through the top ~1.2 mm of 2 mm-thick tissue perfused slices with acrylamide monomer concentrations, by column, of 1% (A, E), 2% (B, F), 3% (C, G), and 4% (D, H) and cleared with either 4% (top row) or 8% SDS (bottom row). Note the most consistent z-plane staining is achieved using 2% and 3% monomer. Abbreviations: mono; monomer, SDS; sodium dodecyl sulfate.