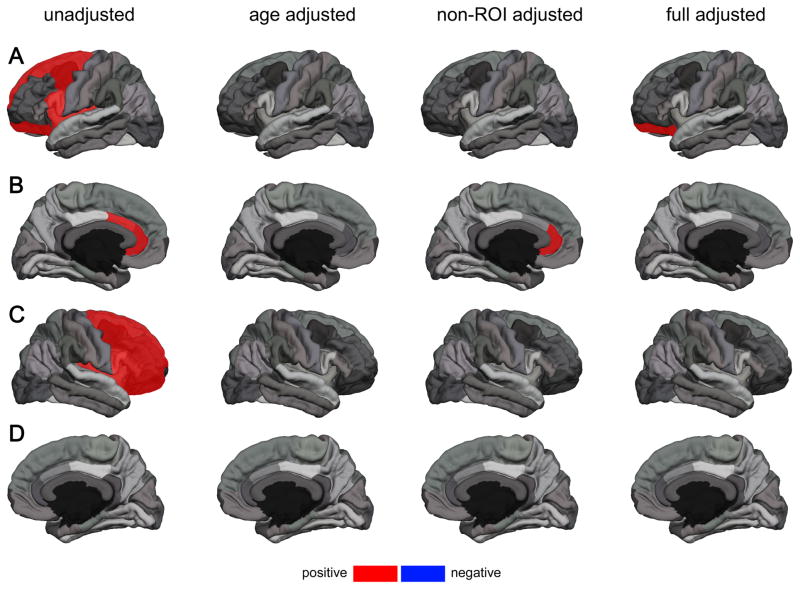
Figure 2. Significant Correlations of Cortical Thickness in Selected Regions of Interest (ROI) with Resting State Heart Rate Variability according to Meta-Analyses across Studies;
results from fixed-effect meta-analyses on (1) zero-order correlation coefficients (unadjusted), (2) partial correlation coefficients adjusted for age (age adjusted), (3) partial correlation coefficients adjusted for non-ROI thickness (non-ROI adjusted), and (4) partial correlation coefficients adjusted for age and non-ROI thickness (full adjusted) (A): left hemisphere lateral view; (B): left hemisphere medial view; (C): right hemisphere lateral view; (D): right hemisphere medial view; ROIs highlighted in red show a significant positive correlation with RMSSD; ROIs highlighted in blue show a significant negative correlation with RMSSD; corresponding correlation coefficients are provided in Table 4 and 5 respectively; note: for clarity the superior frontal gyrus is only highlighted in the lateral view

