
Figure 1. Relationship between dose response and concentration of MPA.
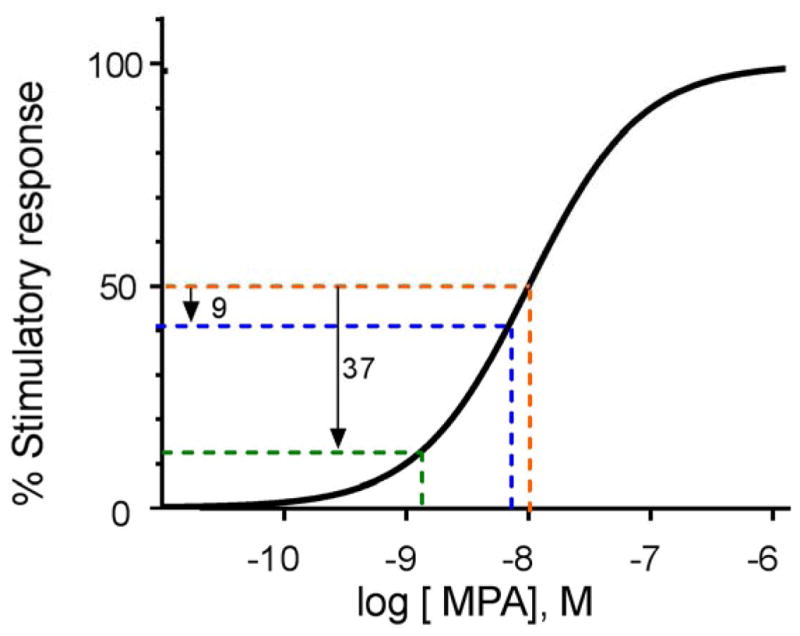
The orange line depicts a 50% increase in a given stimulatory response for a woman using DMPA-IM (versus a woman using no hormonal contraception), assuming that the EC50 value (potency) for that particular biological response occurs at 10 nM MPA (3.8 ng/mL; −8 on the log scale). If we assume that DMPA-SC reduces MPA intracellular concentrations by 31% (from 10 nM assumed with DMPA-IM to 6.9 nM assumed with DMPA-SC), that particular stimulatory response would theoretically be predicted to drop by 9 percentage points, to 41% (blue line) instead of 50% (orange line). If we assume that DMPA-SC reduces intracellular concentrations by 85% (from 10 nM assumed with DMPA-IM to 1.5 nM assumed with DMPA-SC), that particular stimulatory response would be theoretically predicted to drop by 37 percentage points, to 13% (green line) instead of 50% (orange line). Note that the actual EC50 for specific biological responses varies depending on the cell type and target gene, and cannot be predicted. The sigmoidal shaped curve with a Hill slope of one is based on theoretical predictions,[86] and supported by ex vivo data, as discussed in the text.