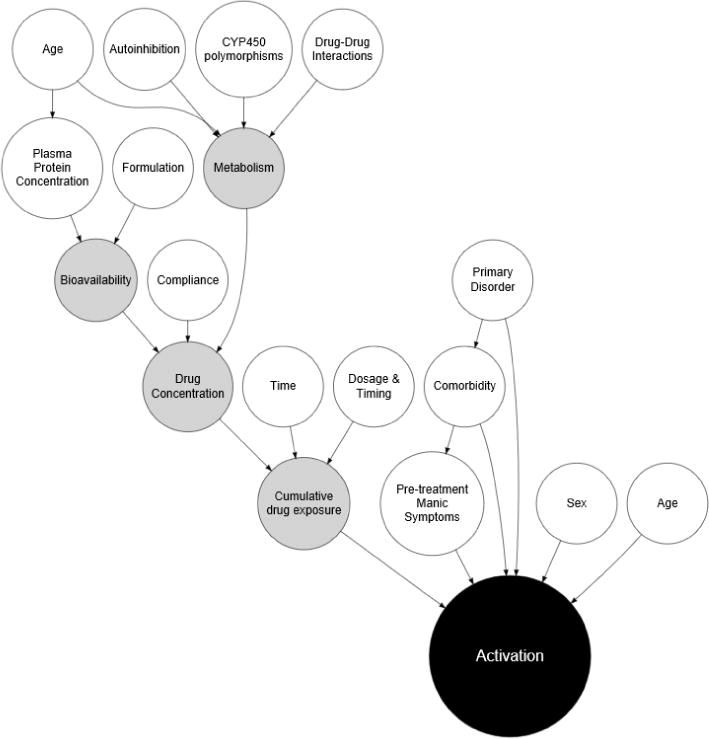
FIGURE 1. Factors that may contribute to activation-related adverse events in pediatric patients.

In this functional causal diagram, white circles represent clinical and demographic risk factors as well as attributes of the medication or its interactions. Gray circles reflect intrinsic metabolism and pharmacologic factors.
