
Figure 5.
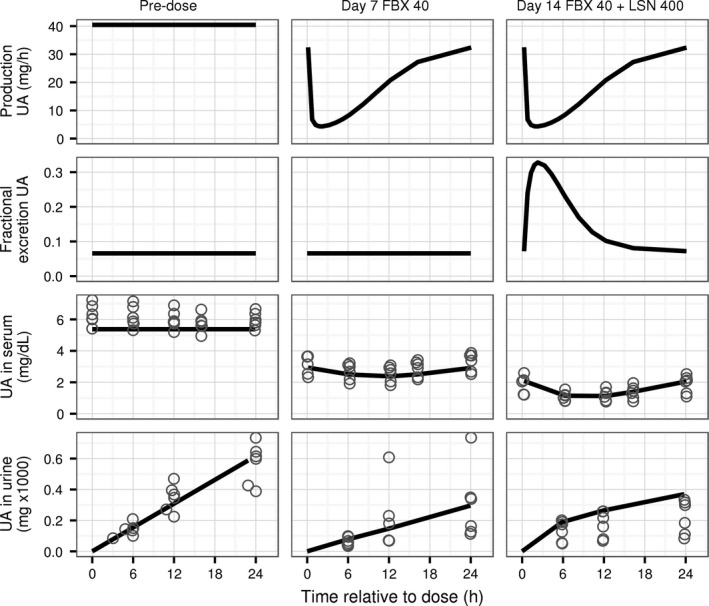
Time profiles of predicted and observed concentration of UA in serum and cumulative amount excreted in urine for daily doses of febuxostat and lesinurad in Study 105 (90 serum samples and 54 urine samples). Left column: predose. Middle column: profiles after 7 days of febuxostat 40 mg once a day. Right column: profiles after 7 days of febuxostat 40 mg and lesinurad 400 mg once a day. Panels across columns show data for the same group of patients switching treatments every 7 days. Top row: predicted production rate of UA. Second row: predicted fractional excretion coefficient of UA in urine. Third row: concentration of UA in serum. Fourth row: cumulative amount of UA in urine (amount was reset to 0 at the start of sampling on day 7 and 14). Horizontal axis shows time after drug dose. Symbols: individual observations. Lines: model predictions. UA, uric acid. LSN, lesinurad. FBX, febuxostat.