
Figure 6.
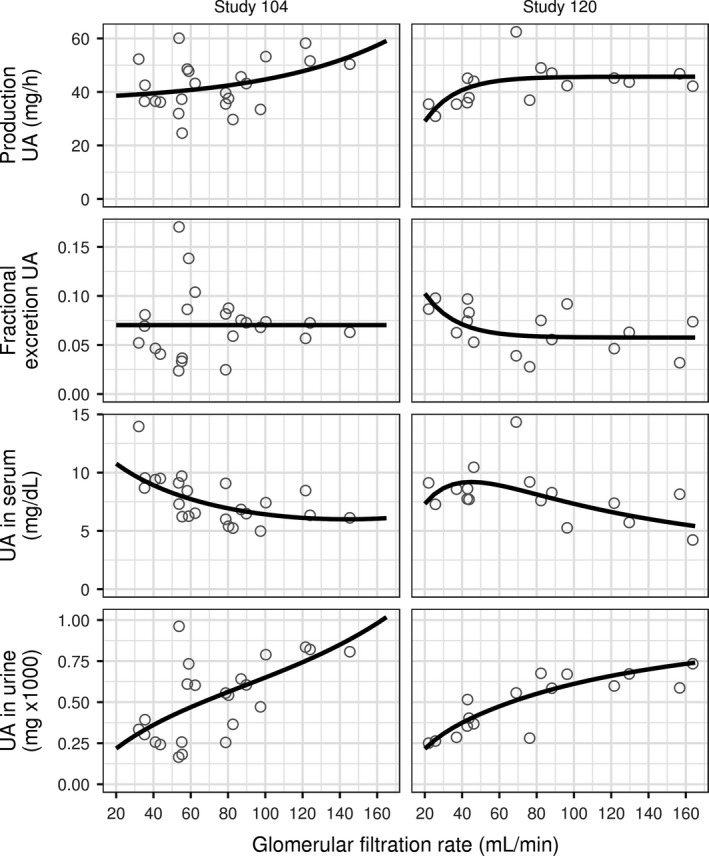
Dependence on glomerular filtration rate of predose steady state concentration of UA in serum (third row from the top) and amount of UA in urine excreted over 24 h (bottom row). Baseline production rate of UA is shown in the top row, baseline fractional excretion coefficient of UA – in the second row from the top. Left column: Study 104 (23 values). Right column: Study 120 (16 values). Symbols: values for individual subjects. Solid lines in the top two rows: interpolation of individual values using nonlinear regression. Solid lines in the bottom two rows: model predictions using interpolated mean production rate and baseline fractional excretion coefficient. UA, uric acid.