
Figure 9.
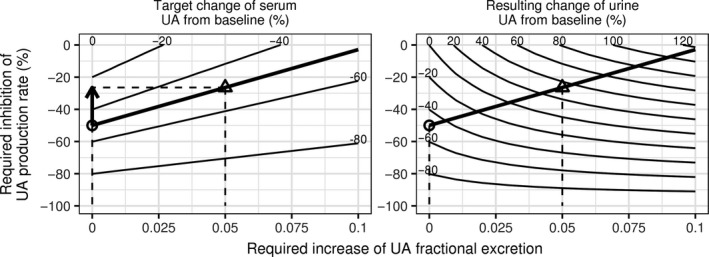
A nomogram of percent inhibition of the UA production rate and increase in UA fractional excretion coefficient in combination required to produce a target percent change in serum UA (left panel) while resulting in percent change in the amount of UA excreted in urine (right panel). Combinations of drug interventions leading to specified percent change in serum and urine UA are shown as contour lines. Increasing the degree of fractional excretion increase results in a lower required inhibition of the production rate, for the same target serum UA change. Thick lines correspond to the target decrease in serum UA by 50% from baseline. Circles indicate a scenario of inhibition of the production rate alone (50%). Triangles indicate a scenario of a combination of increase in fractional excretion by 0.05 and inhibition of the production rate by 26%. Vertical dashed lines indicate increase of fractional excretion for the two scenarios. Horizontal lines indicate inhibition of the production rate for the two scenarios. The arrow indicates the reduced inhibition of the production rate in the combination scenario. The GFR is 60 mL/min. The baseline fractional excretion coefficient is 0.03. Baseline serum UA was 12 mg/dL. UA, uric acid.