
Figure 11.
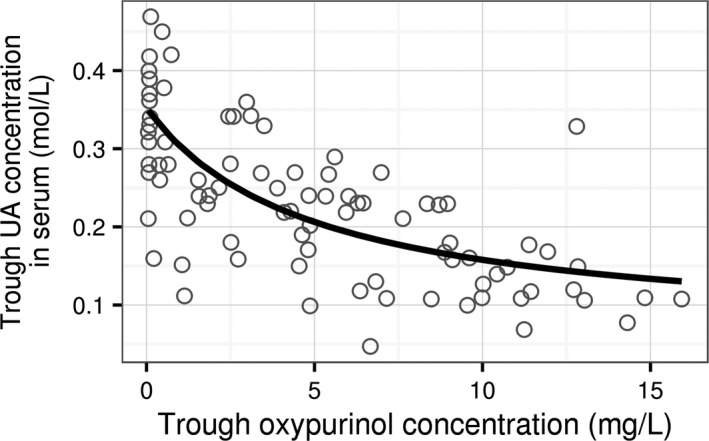
Simulation of mean trough serum uric acid concentration after 7 daily doses of allopurinol using estimated model parameters (line) and observed values (symbols).
Official websites use .gov
A
.gov website belongs to an official
government organization in the United States.
Secure .gov websites use HTTPS
A lock (
) or https:// means you've safely
connected to the .gov website. Share sensitive
information only on official, secure websites.
Simulation of mean trough serum uric acid concentration after 7 daily doses of allopurinol using estimated model parameters (line) and observed values (symbols).