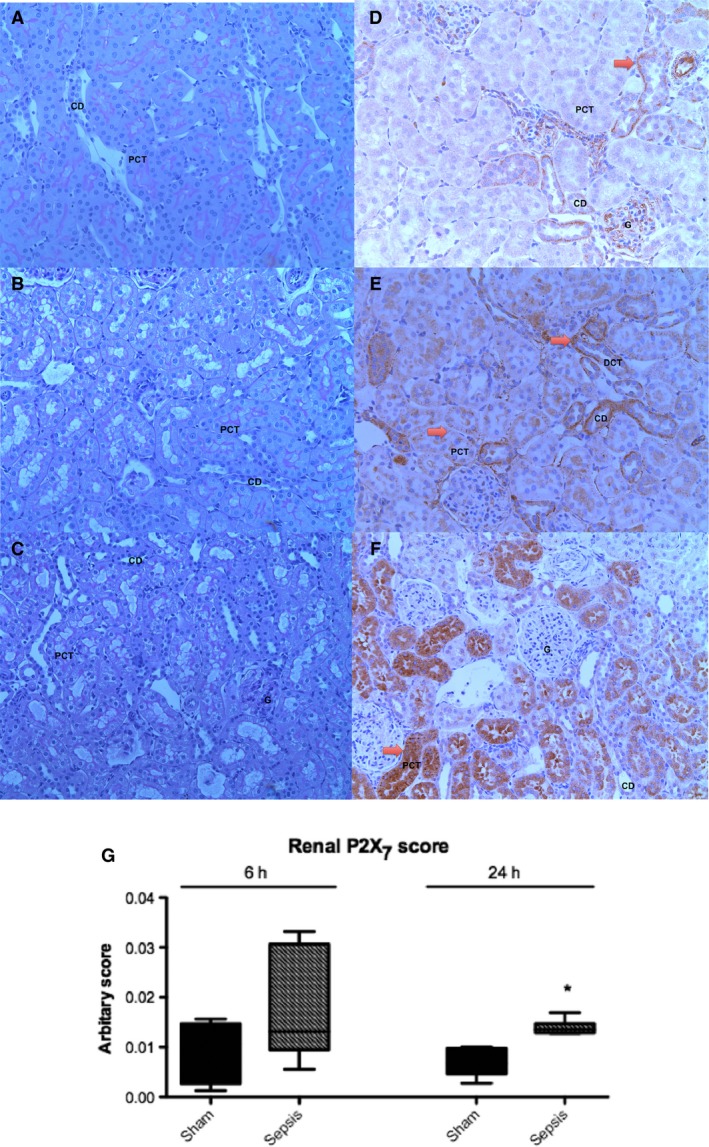
Figure 3.

Histological analysis of kidney sections from naïve, 6 h septic, and 24 h septic animals. All images taken at x20 magnification. (A) Naive kidney with no tubular injury (B) Kidney demonstrating minimal tubular injury 6 h following induction of sepsis (C) Kidney demonstrating minimal tubular injury 24 h following induction of sepsis (D) Naive kidney with minimal tubular P2X7, (E) Kidney from a 6 h septic animal with minimal P2X7, mainly within the basolateral regions of tubules (F) Kidney from a 24 h septic animal with a similar pattern as the 6 h septic animals but greater intensity and wider distribution (G) Immunohistochemistry image analysis units for P2X7 expression in sham and septic animals (n = 6–8 per group). There is significantly increased renal tubular P2X7 expression at 24 h in septic animals compared with sham animals. Box plots represent median and interquartile range and whiskers represent minimum and maximum. (*P < 0.05 sham vs. septic animals). G, glomerulus; PCT, proximal convoluted tubule; DCT, distal convoluted tubule; CD, collecting duct; Arrow, P2X7 staining.
