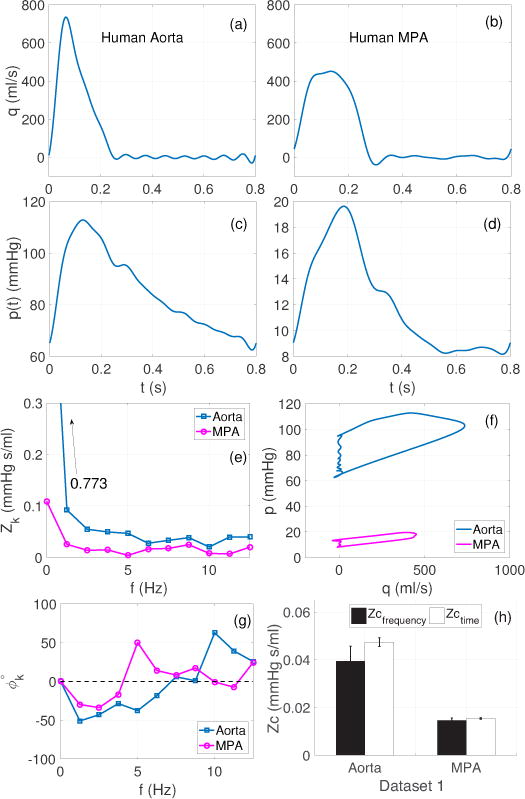
Figure 1.

Dataset 1 (Section 2.1): Frequency and time domain analysis using pressure and flow wave forms from the human aorta and main pulmonary artery (MPA). (a)–(d): pressure (left), flow (right). Note the difference in scale between the aortic and MPA pressures. (e) and (g): corresponding impedance moduli and phase spectra, (f): pressure-flow loops, used for estimating Zc with the time domain up-slope methods, (h): comparison of Zc in the aorta and MPA across both domains. The bars show mean ± SD values of Zc, across all the frequency and time domain methods listed in Table 1.
