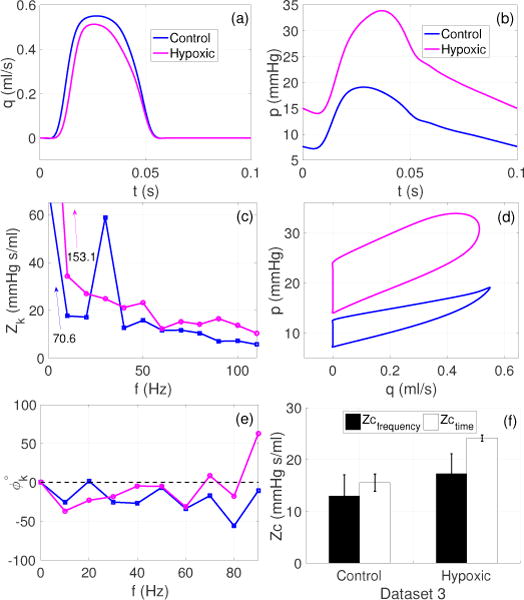
Figure 10.

Dataset 3. Estimates of Zc in mice pulmonary arteries during control and hypoxia. (a)–(b): Representative pressure (p) and flow (q) waveforms plotted for one cardiac cycle for the control and hypoxic groups, (c) and (e): corresponding impedance moduli (Zk) and phases (ϕk) spectra for 0–10 harmonics, (d): corresponding pressure-flow loops for the control and hypoxic cases, and (f): comparison of frequency and time domain estimates where the bars show the mean ± SD values of Zc, across all the frequency and time domain methods listed in Table 1.
