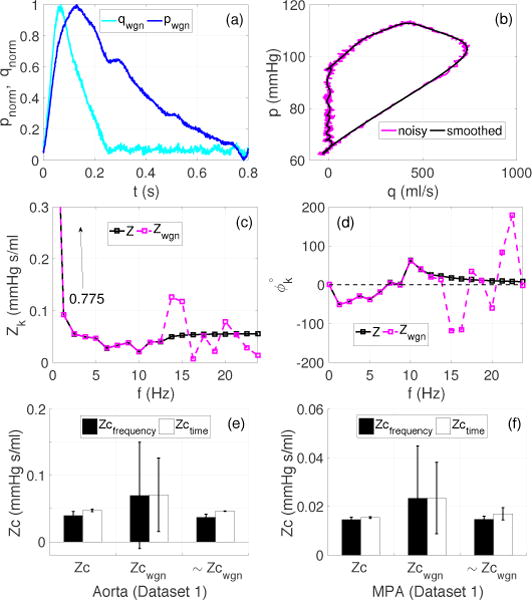
Figure 3.

Case 2 (Dataset 1): Effects of noise on the Zc estimates. (a): Normalized pressure and flow waveforms (dimensionless) in the aorta, contaminated with Gaussian white noise generating a 40 dB SNR, (b): pressure-flow loops from normal (see Figure 1 (a)) and noisy pressure (pwgn) and flow (qwgn) signals, (c)–(d) impedance moduli and phase for the first 19 harmonics computed using normal (Z) and noisy (Zwgn) datasets, (e)–(f): effects of noise on the grouped averaged Zc for the aorta and MPA, where Zc and Zcwgn are the group averaged Zc accounting for all the methods listed in Table 1. ~Zcwgn excludes all frequency domain methods, which require harmonics above 12.5 Hz, and the peak derivative method (Zc′) in the time domain.
