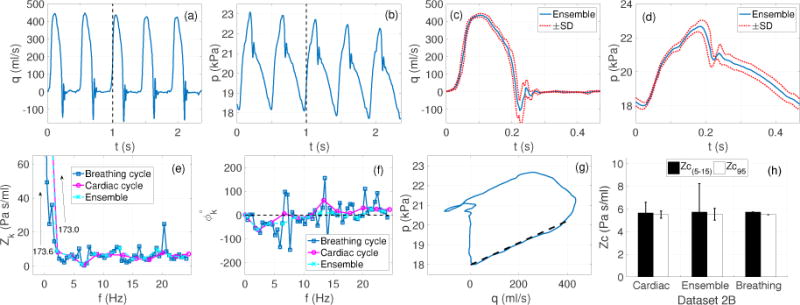
Figure 4.

Case 3 (Dataset 2B): Effects of single beat, breathing cycle (multi-beat) and ensemble encoding approach on the Zc estimates (Murgo et al 1980). (a)–(b): Pressure and flow data over five cardiac cycles reproduced with permission from Dujardin & Stone (1981) (c)–(d): ensemble encoding (blue curves)±SD (dotted red curves) of the flow and pressure waveforms, (e)–(f): impedance moduli and phase spectra obtained by subjecting all five cycles (blue curve representing breathing cycle analysis), a representative cardiac cycle (magenta curve representing beat by beat analysis) and ensemble encoding (cyan curve), to the Fourier analysis (g): the pressure-flow loop (blue curve) from the ensemble encoded waveform with the fitted line at qc = 0.95 (dashed balck), (h): comparison of Zc(5–15) and Zc95 using the three approaches: (left) the cardiac cycle approach, error bars show mean±SD Zc values over five cardiac cycles analyzed individually, (center) ensemble encoding approach, the error bars show the estimates corresponding to dotted red curves in (c) and (d), (right) breathing cycle approach.
