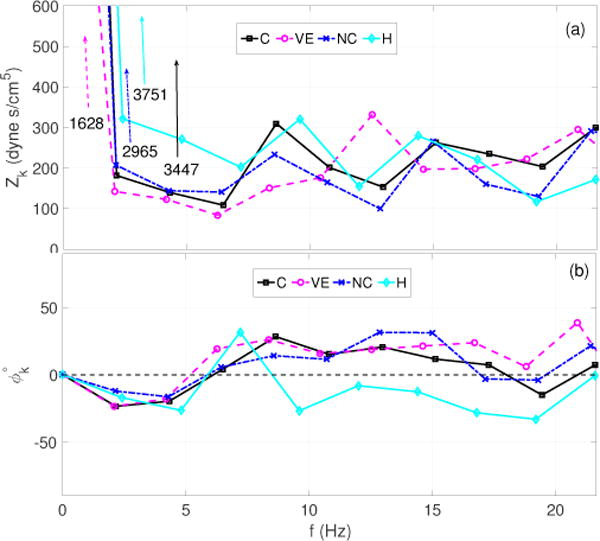
Figure 7.

Dataset 2A: Impedance moduli (a) and phase spectra (b) corresponding to each case (C, VE, NC and H) presented in Figure 6. The spectra are generated using the second cardiac cycle in the in the sequence of pressure and flow waveforms and only show 0–10 harmonics after the mean component.
