
Figure 8.
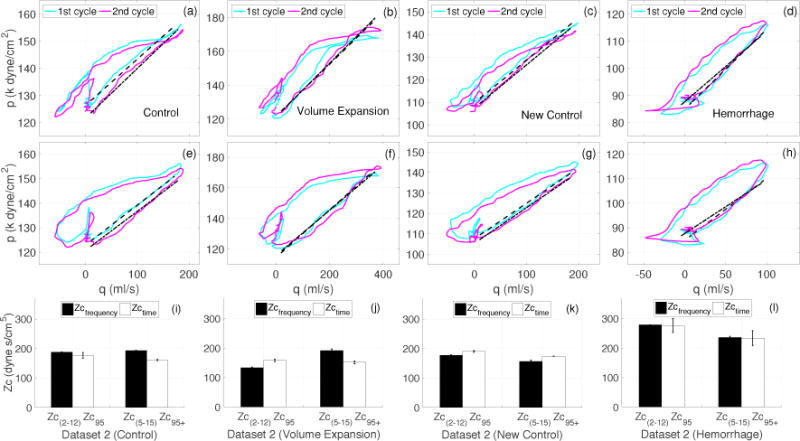
Case 4 (Dataset 2A): Comparison of frequency and time domain estimates of Zc calculated form the dataset 2A (Figs. 7 and 6. (a)–(d): Pressure-flow loops with qc = 0.95 providing Zc95. (e)–(h): Pressure-flow loops with pressure delayed by 7 ms, and qc = 0.95 providing modified Zc95+, (i)–(l): comparison of frequency domain Zc(2–12), Zc(5–15) (see Table 1) with time domain Zc95 and Zc95+. The bar charts show the mean±SD of all estimates computed from each cardiac cycle shown in Figure 6.