Figure 9.

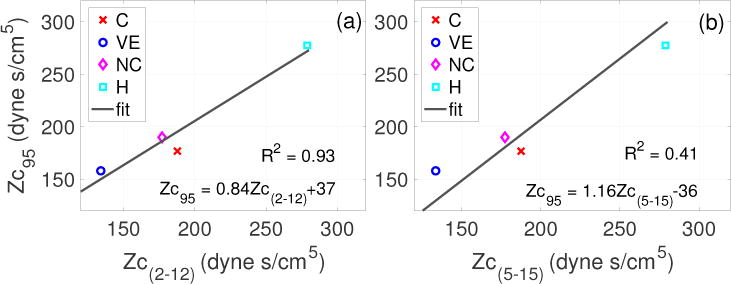
Case 4 (Dataset 2A): Following Murgo et al (1980), regression line depicting the linear relationship between Zc95 and Zc(2–12) (a), and Zc95 and Zc(5–15). Coefficient of correlation, R2, is 0.93 and 0.41, respectively.

Case 4 (Dataset 2A): Following Murgo et al (1980), regression line depicting the linear relationship between Zc95 and Zc(2–12) (a), and Zc95 and Zc(5–15). Coefficient of correlation, R2, is 0.93 and 0.41, respectively.