
Figure 9.
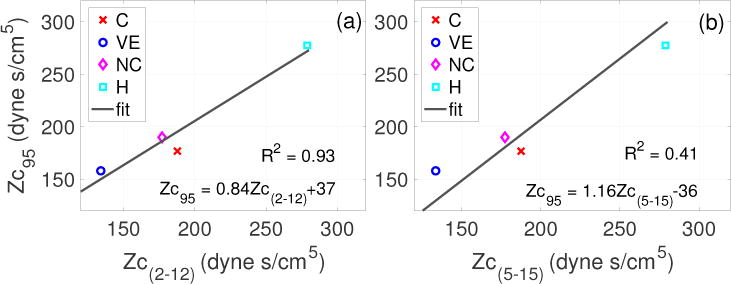
Case 4 (Dataset 2A): Following Murgo et al (1980), regression line depicting the linear relationship between Zc95 and Zc(2–12) (a), and Zc95 and Zc(5–15). Coefficient of correlation, R2, is 0.93 and 0.41, respectively.
Official websites use .gov
A
.gov website belongs to an official
government organization in the United States.
Secure .gov websites use HTTPS
A lock (
) or https:// means you've safely
connected to the .gov website. Share sensitive
information only on official, secure websites.
Case 4 (Dataset 2A): Following Murgo et al (1980), regression line depicting the linear relationship between Zc95 and Zc(2–12) (a), and Zc95 and Zc(5–15). Coefficient of correlation, R2, is 0.93 and 0.41, respectively.