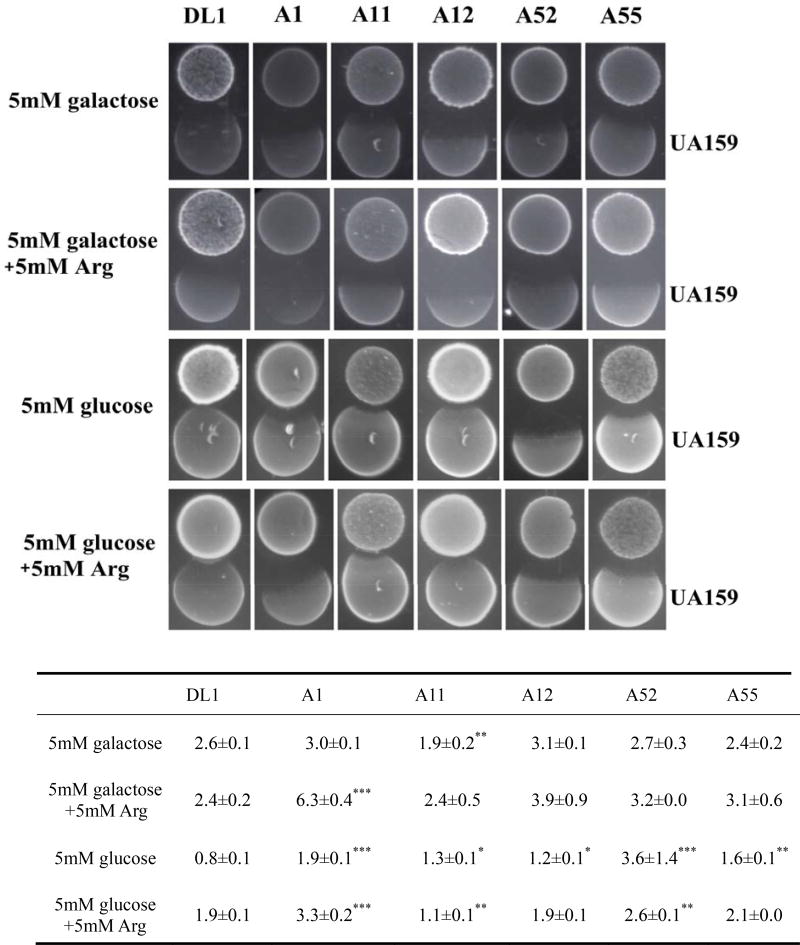
Figure 1.
Growth inhibition zones of arginolytic strains on S. mutans UA159 on saliva agar plates under different growth conditions. Arginolytic strains were inoculated first and S. mutans UA159 was inoculated 24 h later. The table below the figure shows the mean average of inhibition zones ± standard deviation in millimeters. (*) indicates that the inhibition zone of the arginolytic strain on S. mutans UA159 is significantly different compared to S. gordonii DL1 in a given growth condition.

