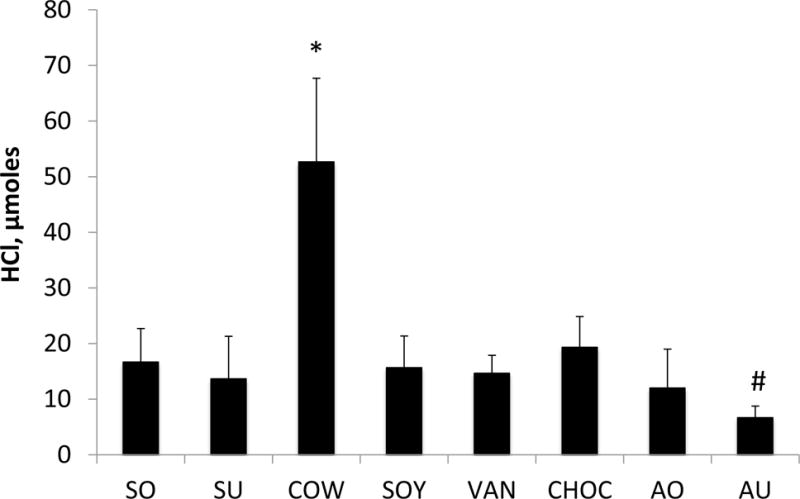
Figure 4. Buffering capacity of milk and milk alternatives.

The buffering capacity of the milk beverages was measured by pH titration and is expressed as μmoles of HCl needed for titrating the pH by one unit. Data represent averages (±SD in error bars, N=3) of three sets of separate experiments. *P<0.001, COW vs. all others; AU # P<0.05 vs. all others except SU and AO.
