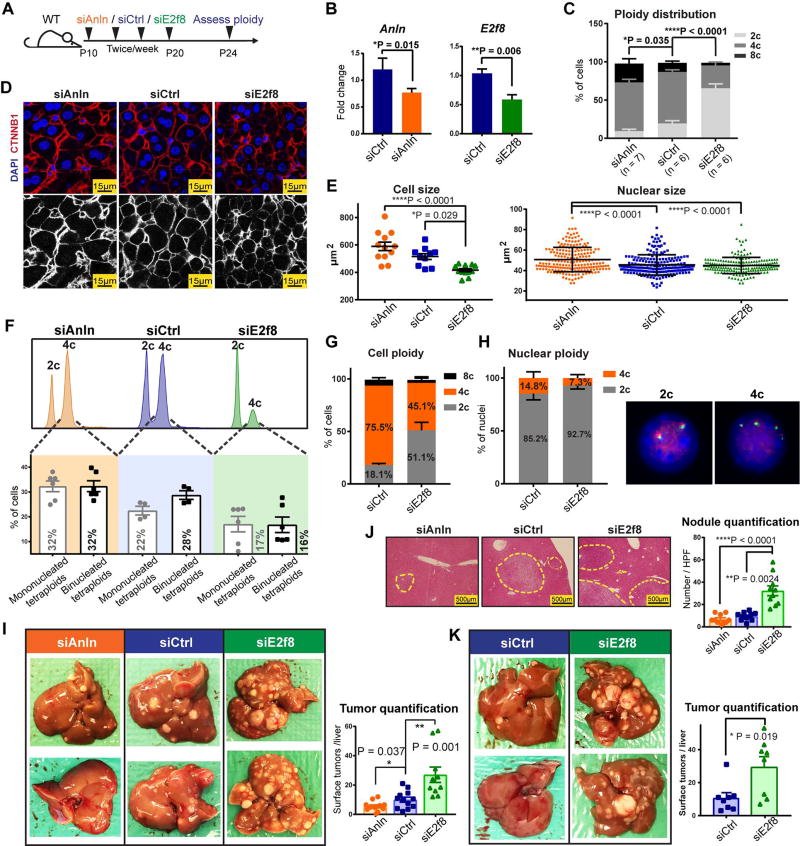
Figure 2. In vivo siRNAs that toggled ploidy revealed that the polyploid state protected against tumorigenesis.
(A) Schema for the siRNA experiment: Anln, E2f8, and scramble siRNAs (siCtrl) were encapsulated into lipid nanoparticles and injected into WT C3H strain mice starting at P10. Four total injections (two intraperitoneal and two retro-orbital) were performed twice per week. Between P24–26, hepatocytes were dissociated for ploidy analysis or mice were injected with DEN (75µg/g). Tumor burden was examined six months later.
(B) mRNA knockdown after Anln and E2f8 siRNA treatments. RT-qPCR was performed on the liver 4 days after the last siRNA dose.
(C) Average cellular ploidy distribution within livers, as determined by PI staining and flow cytometry (n = 6 mice in each group were analyzed).
(D) Confocal images of DAPI and CTNNB1 stained siRNA treated livers. The bottom images highlight CTNNB1 staining alone, marking membranes and cellular outlines.
(E) Cross-sectional cell and nucleus size measurements. Each group includes 12 total analyzed image fields from 4 individual mice. For nucleus size quantification, each data point is one nucleus; for cell size quantification, each data point is an average of the cell sizes from one image and 3 images were taken from each mouse.
(F) Representative cellular ploidy distribution of siRNA treated livers (upper panel). The lower panel shows the distribution of mono- and binucleated tetraploid hepatocytes. Calculations were performed as follows: % of mononucleated tetraploid cells = % tetraploid cells by FACS − % binucleated cells by confocal (images from Figure 2D, n = 3 images were counted for each mouse, 2 mice for each group).
(G) Cellular ploidy distribution of siRNA treated livers, as determined by Flow Cytometry (n = 2 mice/group).
(H) On the left is the nuclear ploidy of the above siRNA treated livers, as determined by FISH. 60 nuclei were analyzed for each mouse. On the right are representative images showing a 2c and a 4c nucleus. 2 green and 2 red signals identify a 2c nucleus. 4 green and 4 red signals identify a 4c nucleus.
(I) Gross tumor burden of siRNA treated livers harvested 6 months after DEN injection. Quantification of liver surface tumor numbers (right panel).
(J) H&E liver histology showing tumor nodules circled by dashed lines (left panel). Quantification of microscopic nodules (right panel).
(K) Tumor burden in mice treated with DEN at later time points after siRNA delivery. Mice were treated with four doses of siRNAs. 14 days after the last siRNA injection, one dose of DEN (100µg/g) was given, and 7.5 months later, tumor burden was assessed (n = 8 in each group). The liver surface tumors were quantified in the right panel.
See also Figure S2 and Figure S3.

