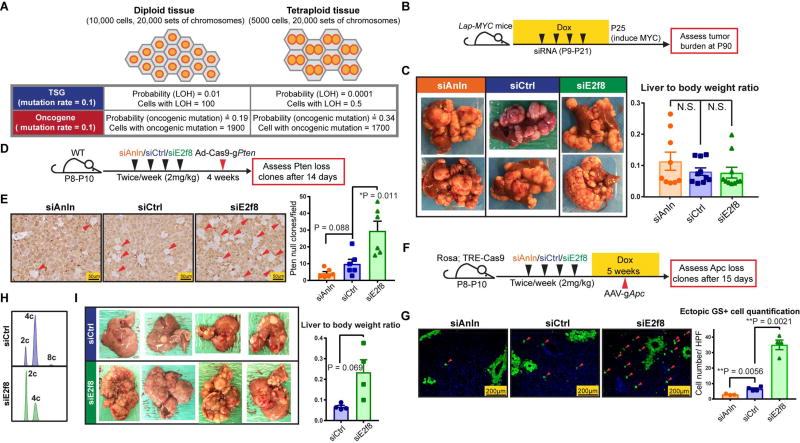
Figure 5. Polyploids were protected from tumor suppressor LOH but not oncogene activation.
(A) Theoretical calculation of the risk of TSG loss and oncogene activation in tissues with diploid vs. tetraploid cells.
(B) Schema of the LAP-MYC experiment: prior to inducing MYC overexpression by dox withdrawal at P25, LAP-tTA; TRE-MYC mice were given four doses of siRNA to transiently alter ploidy, as described in previously. At P30, ploidy distribution and MYC expression levels were measured; At P90, tumor burden was assessed.
(C) Tumor burden at P90 (left panel). Liver to body weight ratios, another metric of tumor burden, are shown in the right panel.
(D) Schema of the Ad-Cas9-sgPten experiment: WT mice were given four doses of siRNA to alter ploidy; one week later, adenovirus carrying Cas9 and a Pten sgRNA (Ad-Cas9-sgPten) was injected into these mice (109 pfu/mouse); 14 days later, LOH was assessed by PTEN IHC.
(E) PTEN staining (left panel) on siAnln, siCtrl, and siE2f8 treated livers 14 days after virus injection. Red arrowheads point to the cells without PTEN, quantification on the right.
(F) Schema of the AAV-sgApc experiment: Dox inducible Rosa-rtta; TRE-Cas9 mice were given four doses of siRNA to alter ploidy. Five days later, dox (1g/L) was given to induce Cas9 expression. Two weeks after the last dose of siRNA, AAV-sgApc (5 × 10¹² pfu/mouse) was retro-orbitally delivered; 15 days later, the Apc LOH was estimated by Glutamine Synthetase (GS) IF.
(G) GS staining (left panel) 15 days after AAV-sgApc injection. Red arrowheads point to ectopic GS positive cells that result from homozygous Apc deletion. Note that the normal, non-ectopic GS staining that surrounds central veins (CV) was not quantified. Ectopic GS positive cells per imaging area were quantified in the right panel.
(H) Representative cellular ploidy distribution of P53fl/fl; Rb1fl/fl; Rbl2fl/fl hepatocytes treated with 4 doses of siRNAs (siCtrl or siE2f8) from P10–P21, as determined by PI staining and flow cytometry at P24.
(I) One week after ploidy was altered with siRNAs, the mice were injected with Ad-Cas9-sgPten (109 pfu/mouse) and AAV-Cre (2.5 × 10¹⁰ pfu/mouse). Tumor burden was examined 2.5 months later. Liver to body weight ratios (right).
See also Figure S5 and Figure S6.

