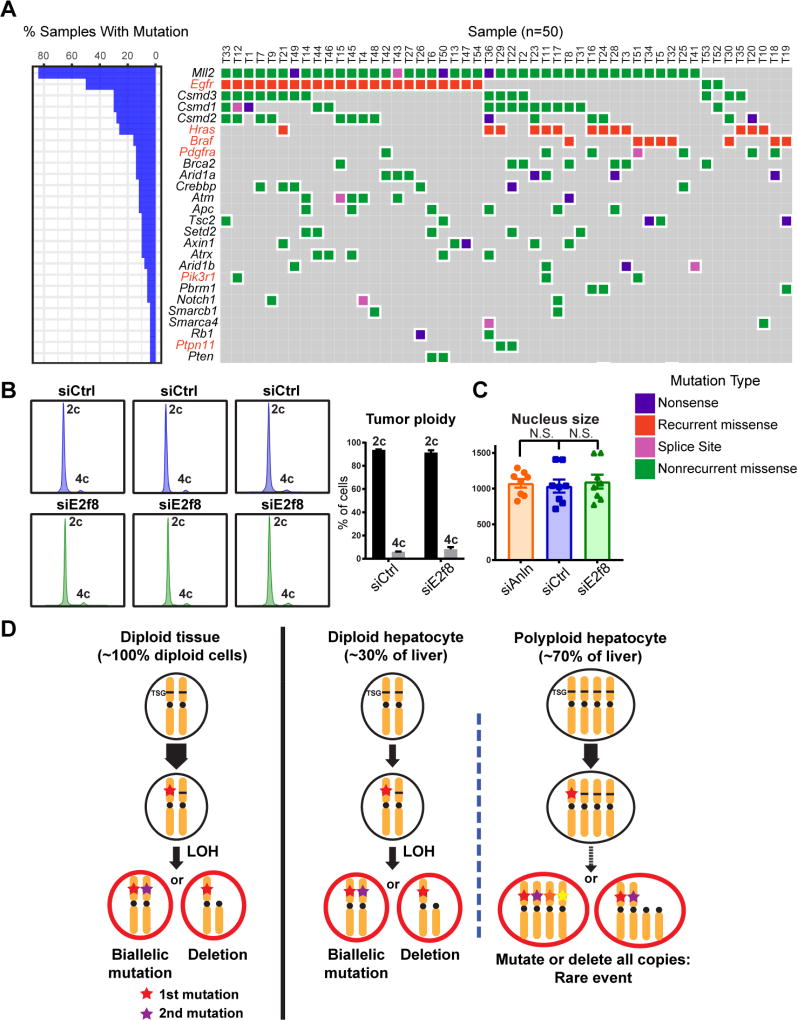
Figure 6. Tumor suppressor mutations are prevalent in liver tumors from diploid and polyploid mice.
(A) Targeted sequencing on 50 DEN induced liver tumors. 242 of the most commonly mutated genes in human and murine HCC were sequenced. Genes highlighted in red are oncogenes and those in black are TSGs.
(B) Cellular ploidy distribution of DEN induced tumors from siRNA treated mice. Data is averaged on the right (tumor n = 10).
(C) Nucleus sizes of tumors from siRNA treated mice. The nucleus size was quantified using Photoshop based on H&E staining images. 4 mice in each group were quantified, 2 tumors per mouse.
(D) This model depicts how TSGs could be lost in diploid and polyploid cells. Note that the liver contains both diploid and polyploid cells.
See also Table S2.

