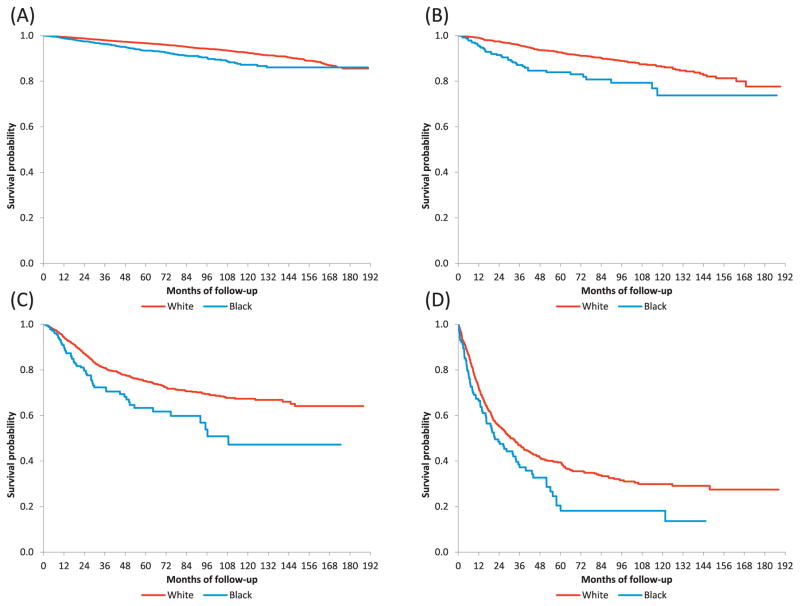
Figure 2.
Kaplan-Meier curves by race, stratified by stage. (A) stage I, p-value < 0.001; (B) stage II, p-value < 0.001; (C) stage III, p-value < 0.001; (D) stage IV, p-value = 0.02. Patients with missing follow-up time or vital status were excluded, including 1,691 stage I, 130 stage II, 218 stage III, and 87 stage IV patients. P-values were from log-rank tests.

