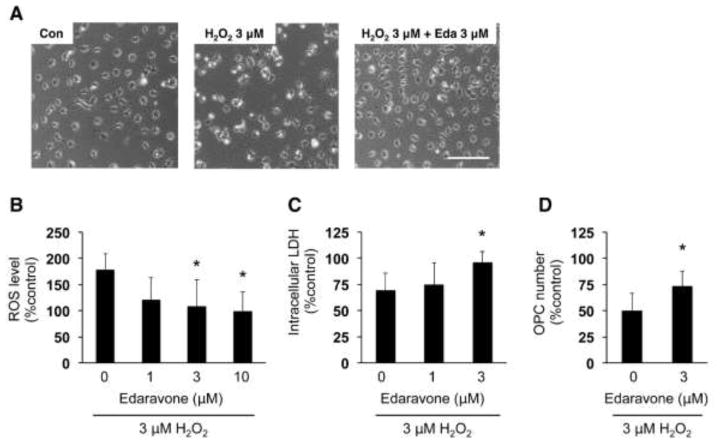
Figure 4. Edaravone protected OPCs against H2O2-induced oxidative stress.
(A) Representative images of OPCs at 24 hours after H2O2 treatment. Scale bar = 100 um. (B) ROS levels in cultured OPCs were detected by the DCF assay. OPCs were subjected to 3 μM H2O2 with or without edaravone. Three hours later, the OPCs were used for DCF assay to measure ROS levels. The percent of ROS level was calculated based on the control group (e.g. cells without drug treatment). Values are mean ± SD from five independent experiments. *P<0.05 vs H2O2 alone. (C, D) OPC damage was assessed by measuring intracellular LDH amount (C) and counting OPC numbers (D). OPCs were subjected to 3 μM H2O2 with or without edaravone. Twenty-four hours later, OPCs images were taken for cell counting and cell culture lysates were used for LDH assay. The percent of intracellular LDH or OPC number was calculated based on the control group (e.g. cells without drug treatment). Values are mean ± SD from six independent experiments. *P<0.05 vs H2O2 alone.

