Figure 2.
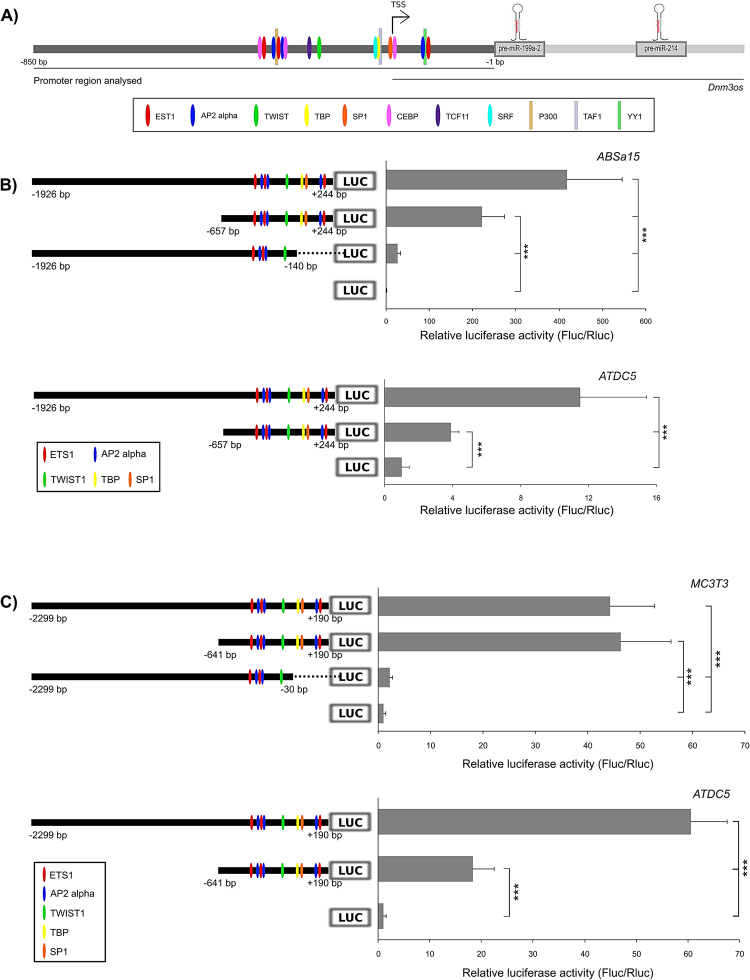
Dnm3os promoter is active in skeletal cell lines. (A) Schematic representation of Dnm3os gene (not scaled) and promoter region analysed (~850 bp). Putative promoter sequences of 8 vertebrates were aligned using CHAOS/DIALIGN, and then fed to ConTra v2: core match = 0.95, similarity matrix = 0.85, TRANSFAC database. TFBS predicted are indicated. Vertical lines indicate previously validated TFBS (by ChIP-assay) according to UCSC Genome browser. TSS, Transcriptional Start Site, based on human mRNA sequence; bp, base pairs. (B) Functional analysis of zebrafish dnm3os putative promoter activity in ABSa15 and ATDC5. Cells were transfected with zebrafish full (−1926 bp/+244 bp), partial (−657 bp/+244 bp), TATA-less (−1926bp/−140bp) promoter constructs, or promoter-less vector. (C) Functional analysis of human Dnm3os putative promoter activity in MC3T3 and ATDC5. Cells were transfected with human full (−2299 bp/+190 bp), partial (−641 bp/+190 bp), TATA-less (−2299bp/−30bp) promoter constructs, or promoter-less vector. For B) and C), a schematic representation of each construct and the respective putative TFBS are indicated on the left side. Values are the mean ± s.d. of at least 5 independent experiments; one-way Anova, ***p < 0.001.

