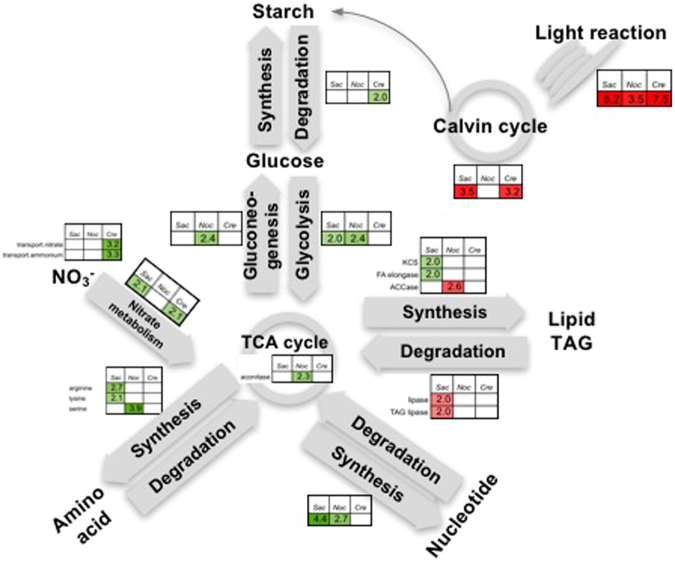
Figure 7.
Comparative transcriptome response of oleaginous microalgae to nitrogen starvation. PAGEMAN over-representation analysis was conducted on the gene expression data (FDR < 0.01) using the Fisher method with the cutoff of <2. Green and red represents up-regulation and down-regulation, respectively. Number represent the degree of over-representation (z-score). Data used to reproduce this figure can be found in Supplementary Table 3.

