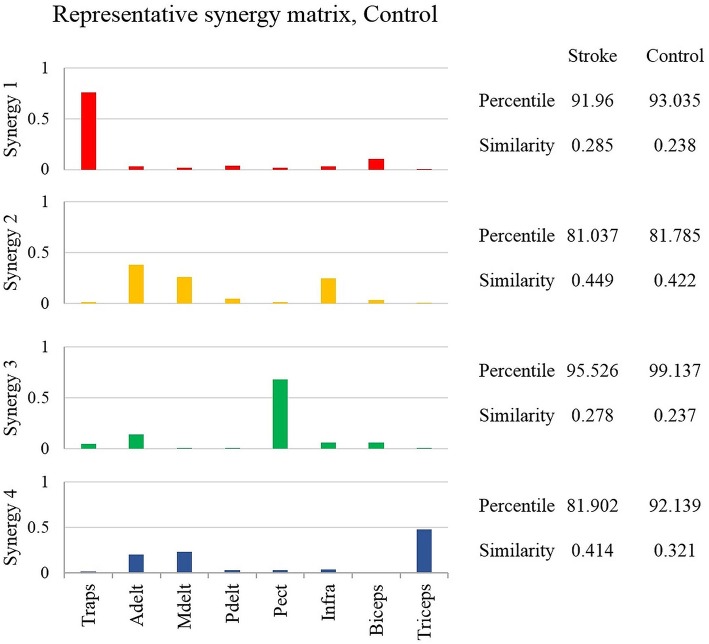
Figure 4.
The representative synergy matrix W5. Each synergy is composed of fixed pattern of muscle activity. The height of the bars refers to the amplitude of activation of a single muscle relative to the other muscles. Since all the muscles that were monitored by the EMG device, composed entire synergy, the amplitude of each synergy sums to one. The similarity between the synergies of each of the participants from both groups and the representative set of synergies was calculated and averaged, and written on the right side of the plot. The similarity index receives values from zero (high similarity) to one (completely different matrices). Determining the identity of synergies to the representative set of synergies, based on the percentile of similarity between the tested synergies among 106 combinations of these synergies, randomly ordered. High percentile values suggest that the tested synergies are similar relative to the same synergies, randomly ordered.

