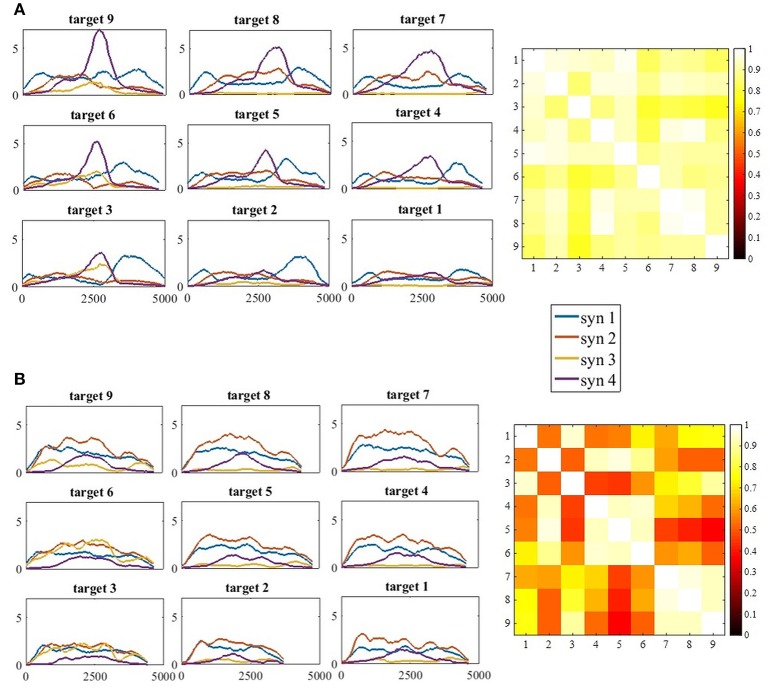
Figure 9.
(A) The full activation coefficients matrix (H) for each movement direction, of participant 11 from the control group (A, Left) and the correlation matrix of the activation coefficient matrices on the right. (B) The full activation coefficients matrix (H) for each movement direction, of participant 11 from the study group (B, Left) and the correlation matrix of the activation coefficient matrices on the right. The four synergies demonstrated different time- patterns of activation for each of the targets. Synergies were differently regulated by the time-coefficients for different targets. In each subplot on the left side (A,B) the x-axis refer to time and the y-axis to the activation coefficient value. Therefore, the values of the y-axis were not normalized. The correlation matrices illustrate high correlations in the control group between all pairs of movement directions, in contrast to the study group that illustrate high correlation values between targets at the same height (4, 5, 6 and 7, 8, 9), but not between different heights (5 vs. 7, 8, and 9).

