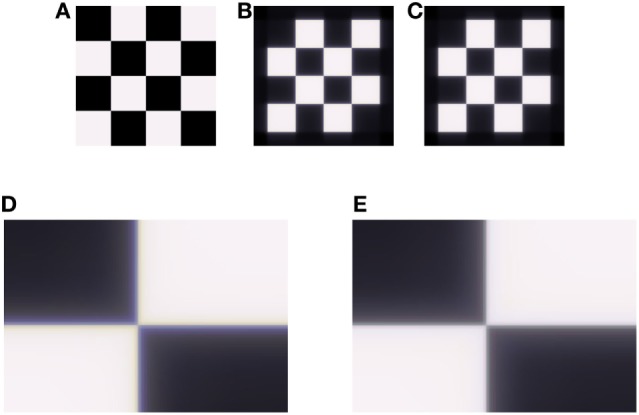
Figure 2.

Demonstration of the longitudinal chromatic aberration (LCA) model on an achromatic grid (A). (B) Retinal image, simulated by ISETBIO toolbox (see Methods). (C) Model prediction for perceived image. (D) Enlarged section of the retinal image (B), the LCA can be seen in vicinity of the edges as lines of a blue–yellow color. (E) Enlarged section of model prediction (C), where there is a correction of the chromatic distortion.
