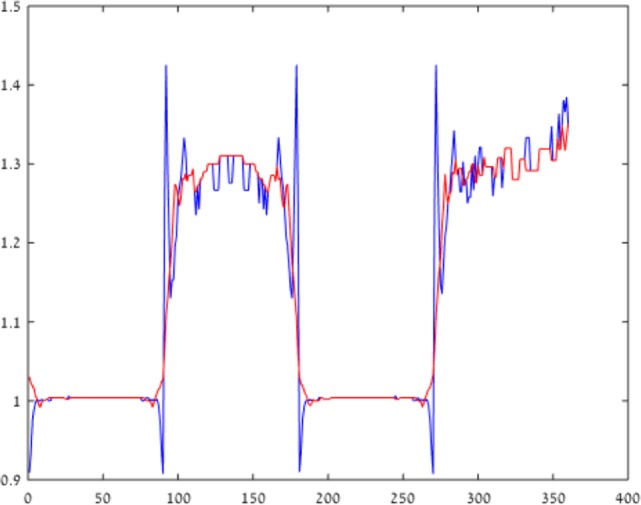
Figure 3.

Blue–yellow chromatic contrast. Blue–yellow chromatic contrast at a cross-section of the retinal image is presented, across a horizontal line in Figure 2 (in blue), while the model correction for longitudinal chromatic aberration (LCA) is represented by the red line. It can be seen that the LCA, which is represented by the blue spikes, is reduced significantly by the model correction (red line), which eliminates the chromatic distortion.
