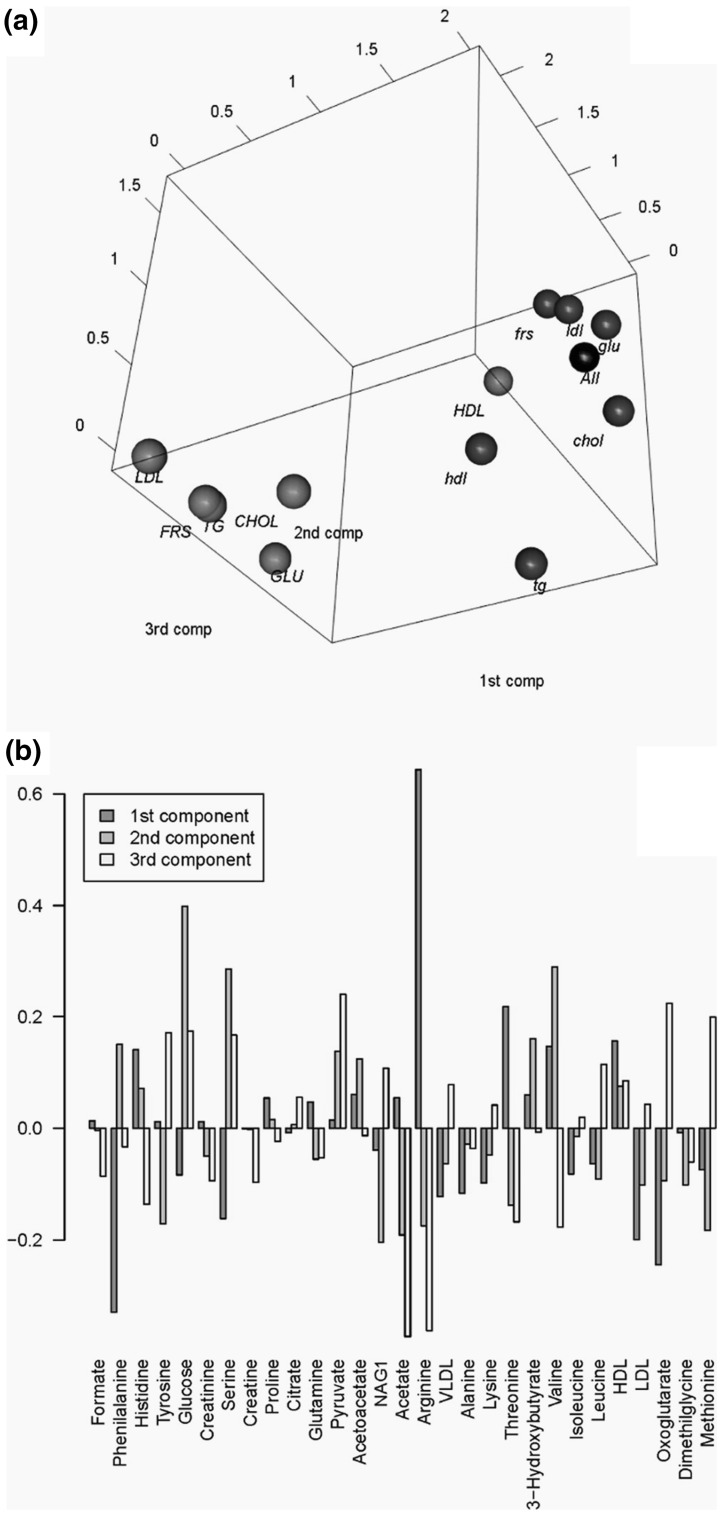
Fig. 3.
a Weight plot and b loadings plot of the INDSCAL model for the metabolite correlation network obtained using the PCLCR method. Each dot represents a network that corresponds to a given cardiovascular (CVD) risk parameter. Blue dots indicate low latent CVD risk, while red indicate high latent CVD risk. The associated CVD risk parameters are indicated in upper case for high risk and lower case for low risk. A reference network (indicated as “All”, black ball), built using all the subjects in the study, is given as reference.
Reproduced with permission from Saccenti et al. (2014). Copyright (2014) American Chemical Society

