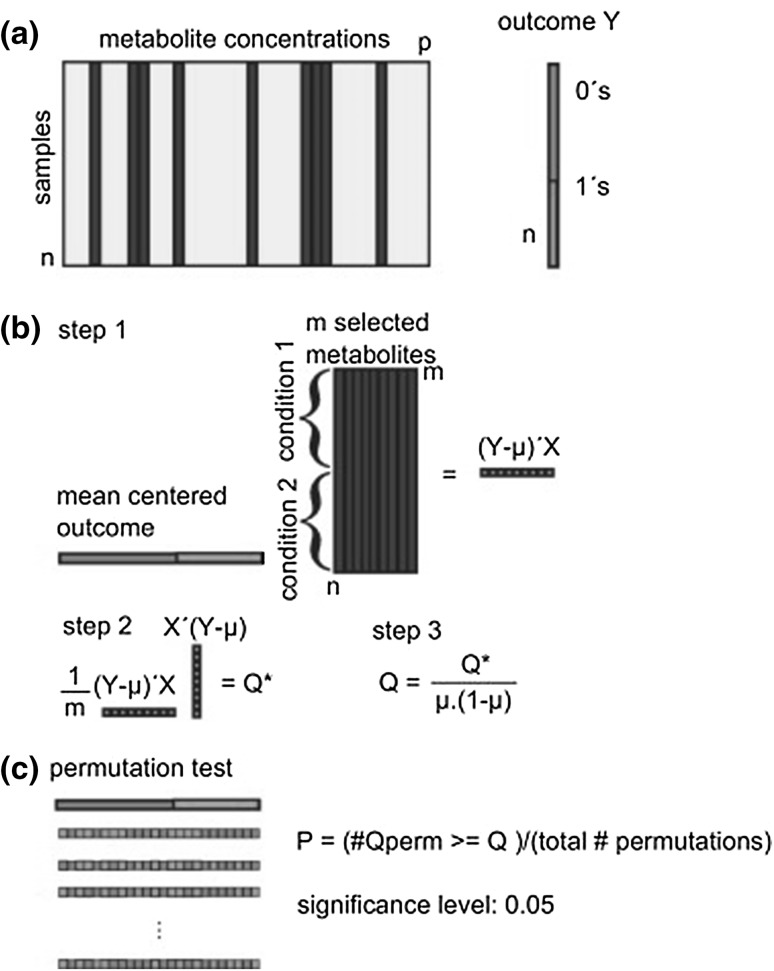
Fig. 5.
Overview of the Global test. a From the autoscaled data matrix, m metabolites belonging to the same pathway are selected. A binary outcome is defined, coded 0 and 1, for instance healthy versus disease. b A score statistic Q is calculated from the mean centered outcome and the matrix of selected metabolites. c The significance of the relation between the group of metabolites (pathway) and the outcome is determined by performing a permutation test.
Reproduced with permission from Hendrickx et al. (2012); Copyright (2012) Elsevier B. V

