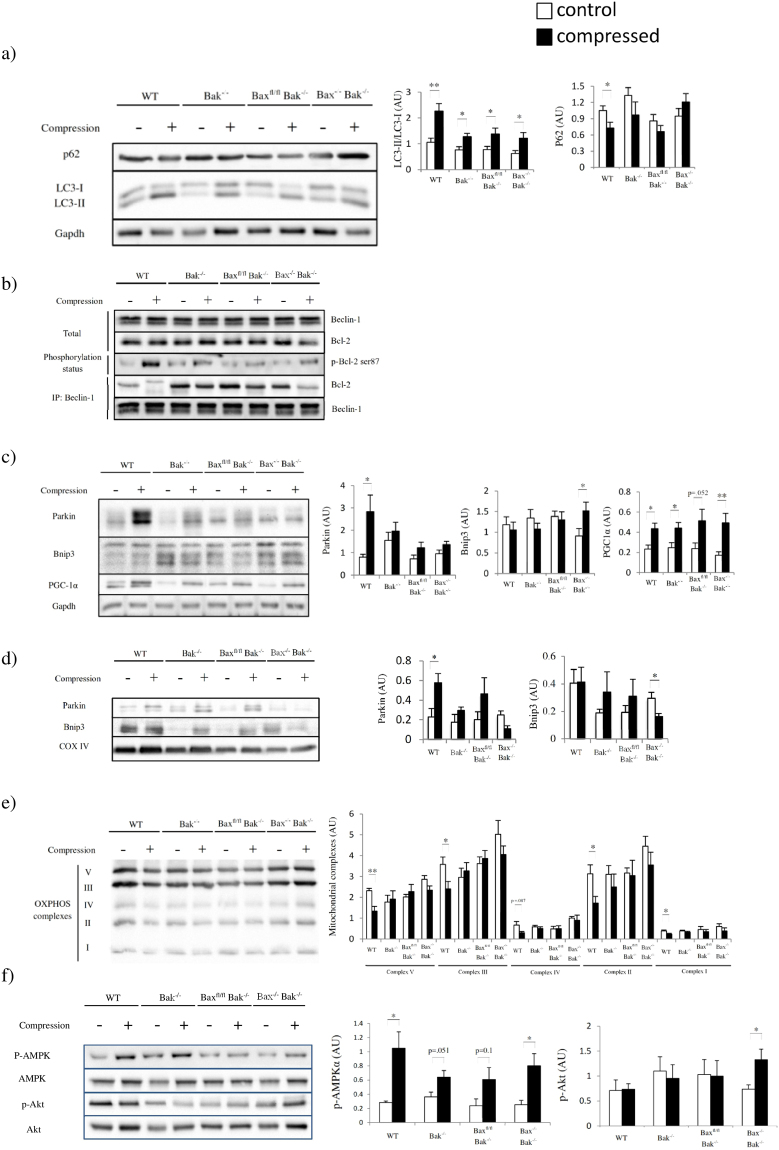
Figure 4.
Compression induces degradation of mitochondria by autophagy. (a) to (e) show the comparison of animals (WT, Bak−/−, Baxfl/flBak−/−, and Bax−/−Bak−/− mice in this order) by Western blots for (a) amounts of p62 and LC3-II/I ratio (n = 6 mice/group), (b) Beclin-1, Bcl-2, phosphorylated Bcl-2 at Ser87, immunoprecipitated Bcl-2, and immunoprecipitated Beclin-1 proteins (n = 4 mice/group), (c) Parkin, Bnip3 and PGC-1α proteins (n = 6 mice/group), (d) mitochondrial Parkin and Bnip3, (e) mitochondrial complexes (n = 4 mice/group), including complexes I-V, and (f) AMPK and Akt protein phosphorylation status in control (“−” or clear bars) and compressed (“+” or shaded black bars) muscle tissues. Pairwise comparison was performed with Student’s t-test, *P < 0.05, **P < 0.01.

